Calcium signaling is involved in cadmium-induced neuronal apoptosis via induction of reactive oxygen species and activation of MAPK/mTOR network - PubMed (original) (raw)
Calcium signaling is involved in cadmium-induced neuronal apoptosis via induction of reactive oxygen species and activation of MAPK/mTOR network
Baoshan Xu et al. PLoS One. 2011.
Abstract
Cadmium (Cd), a toxic environmental contaminant, induces oxidative stress, leading to neurodegenerative disorders. Recently we have demonstrated that Cd induces neuronal apoptosis in part by activation of the mitogen-activated protein kineses (MAPK) and mammalian target of rapamycin (mTOR) pathways. However, the underlying mechanism remains elusive. Here we show that Cd elevated intracellular calcium ion ([Ca²+](i)) level in PC12, SH-SY5Y cells and primary murine neurons. BAPTA/AM, an intracellular Ca²+ chelator, abolished Cd-induced [Ca²+](i) elevation, and blocked Cd activation of MAKPs including extracellular signal-regulated kinase 1/2 (Erk1/2), c-Jun N-terminal kinase (JNK) and p38, and mTOR-mediated signaling pathways, as well as cell death. Pretreatment with the extracellular Ca²+ chelator EGTA also prevented Cd-induced [Ca²+](i) elevation, MAPK/mTOR activation, as well as cell death, suggesting that Cd-induced extracellular Ca²+ influx plays a critical role in contributing to neuronal apoptosis. In addition, calmodulin (CaM) antagonist trifluoperazine (TFP) or silencing CaM attenuated the effects of Cd on MAPK/mTOR activation and cell death. Furthermore, Cd-induced [Ca²+](i) elevation or CaM activation resulted in induction of reactive oxygen species (ROS). Pretreatment with BAPTA/AM, EGTA or TFP attenuated Cd-induced ROS and cleavage of caspase-3 in the neuronal cells. Our findings indicate that Cd elevates [Ca²+](i), which induces ROS and activates MAPK and mTOR pathways, leading to neuronal apoptosis. The results suggest that regulation of Cd-disrupted [Ca²+](i) homeostasis may be a new strategy for prevention of Cd-induced neurodegenerative diseases.
Conflict of interest statement
Competing Interests: The authors have declared that no competing interests exist.
Figures
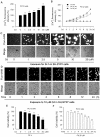
Figure 1. Cd-induced neuronal apoptosis is associated with induction of [Ca2+]i elevation.
(A and B) PC12 cells were treated with 0–20 µM Cd for 24 h, or with 0, 10 and 20 µM Cd for 0–24 h, and then loaded with 5 µM Fluo-3/AM for 30 min at 37°C in the dark, followed by measurement of [Ca2+]i fluorescence intensity, as described in Materials and Methods. (C and D) SH-SY5Y cells were exposed to 0–20 µM Cd for 24 h, or 10 µM Cd for 0–24 h, and then loaded with 2.5 µM Fluo-4/AM for 60 min at 37°C in the dark, followed by recording of the images under a fluorescence microscope. (E and F) Cell viability of PC12 cells, treated with 0–20 µM Cd for 24 h or with 20 µM Cd for 0–24 h, was evaluated by one solution assay. Results are presented as mean ± SE; n = 6. ** P<0.01 difference vs. control group.
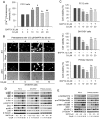
Figure 2. Cd activates MAPK/mTOR pathways and neuronal apoptosis via induction of [Ca2+]i elevation.
Indicated cells were pretreated with/without BAPTA/AM at indicated concentrations for 30 min, and then exposed to Cd (10 and/or 20 µM) for 24 h (A–C) or 4 h (D, E). (A) [Ca2+]i in PC12 cells was determined by measuring Fluo-3/AM-labeled fluorescent intensity, as described in Materials and Methods. (B) [Ca2+]i was stained with Fluo-4/AM and visualized by fluorescence microscopy in SH-SY5Y cells. (C) Cell viability for PC12, SH-SY5Y, and primary neurons was evaluated using one solution assay. (D and E) Indicated cell lysates were subjected to Western blotting using indicated antibodies. The blots were probed for β-tubulin as a loading control. Similar results were observed in at least three independent experiments. Results (A and C) are presented as mean ± SE; n = 6. b P<0.01, difference vs. control group; c P<0.01, difference vs. 10 µM Cd group; d P<0.01, difference vs. 20 µM Cd group.
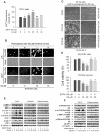
Figure 3. Cd-induced extracellular Ca2+ influx elevates [Ca2+]i contributing to neuronal apoptosis via activation of MAPK and mTOR pathways.
Indicated cells were pretreated with or without 100 µM EGTA for 30 min, and then exposed to Cd (10 and/or 20 µM) for 24 h (A–D) or 4 h (E, F). (A and B) [Ca2+]i fluorescent intensities were evaluated as described in Materials and Methods. (C) Morphology of PC12 cells was assessed using a Nikon Eclipse TE2000-U inverted phase-contrast microscope (200×) equipped with digital camera. (D) Cell viability in SH-SY5Y cells and primary neurons was evaluated by one solution assay. (E and F) Indicated cell lysates were subjected to Western blotting using indicated antibodies. The blots were probed for β-tubulin as a loading control. Similar results were observed in at least three independent experiments. Results (A, D) are presented as mean ± SE; n = 6. b P<0.01, difference vs. control group; c P<0.01, difference vs. 10 µM Cd group; d P<0.01, difference vs. 20 µM Cd group.
Figure 4. Inhibition of CaM by TFP attenuates Cd activation of MAPK/mTOR and apoptosis in neuronal cells.
Indicated cells were pretreated with/without TFP at indicated concentrations for 30 min, and then exposed to Cd (10 and 20 µM) for 4 h (A, B) or 24 h (C). (A and B) Indicated cell lysates were subjected to Western blotting using indicated antibodies. The blots were probed for β-tubulin as a loading control. Similar results were observed in at least three independent experiments. (C) Cell viability for indicated cells was evaluated using one solution assay. Results are presented as mean ± SE; n = 6. a P<0.05, b P<0.01, difference vs. control group; c P<0.01, difference vs. 10 µM Cd group; d P<0.01, difference vs. 20 µM Cd group.
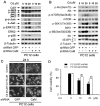
Figure 5. Downregulation of CaM attenuates Cd activation of MAPK/mTOR pathways and apoptosis in neuronal cells.
PC12 Cells infected with lentiviral shRNAs to CaM and GFP, respectively, were exposed to Cd (0–20 µM) for 4 h (A,B) or 24 h (C,D), followed by Western blotting with indicated antibodies (A, B), cell morphological analysis (C) or cell viability assay (D), as described in Materials and Methods. Note: CaM was downregulated by ∼90% by lentiviral shRNA to CaM, compared with the control (lentiviral shRNA to GFP), by densitometry using NIH Image J. Results are presented as mean ± SE; n = 6. a P<0.01, difference vs. control group; b P<0.01, CaM shRNA group vs. GFP shRNA group.
Figure 6. Cd-elevated [Ca2+]i induces ROS in neuronal cells.
Indicated cells were exposed to 0–20 µM Cd for 24 h after pretreatment with/without indicated concentrations of BAPTA/AM (A) or EGTA (B) for 30 min, followed by ROS detection, as described in Materials and Methods. Results are presented as mean ± SE; n = 6. a P<0.05, b P<0.01, difference vs. control group; c P<0.01, difference vs. 10 µM Cd group; d P<0.01, difference vs. 20 µM Cd group.
Figure 7. CaM is essential for Cd induction of ROS in neuronal cells.
Indicated cells pretreated with/without TFP at indicated concentrations for 30 min (A), or infected with lentiviral shRNAs to CaM and GFP, respectively (B), were exposed to 0–20 µM Cd for 24 h, followed by ROS detection, as described in Materials and Methods. Results are presented as mean ± SE; n = 6. a P<0.01, difference vs. control group; b P<0.01, difference vs. 10 µM Cd group; c P<0.01, difference vs. 20 µM Cd group; d P<0.01, CaM shRNA group vs. GFP shRNA group.
Figure 8. Cd-elevated [Ca2+]i induces ROS, triggering apoptosis of neuronal cells.
PC12 cells, pretreated with/without BAPTA/AM, EGTA, and TFP at indicated concentrations for 30 min, were treated with/without 20 µM Cd for 24 h, followed by Western blot analysis using indicated antibodies. The blots were probed for β-tubulin as a loading control. Similar results were observed in at least three independent experiments.
Similar articles
- CaMKII is involved in cadmium activation of MAPK and mTOR pathways leading to neuronal cell death.
Chen S, Xu Y, Xu B, Guo M, Zhang Z, Liu L, Ma H, Chen Z, Luo Y, Huang S, Chen L. Chen S, et al. J Neurochem. 2011 Dec;119(5):1108-18. doi: 10.1111/j.1471-4159.2011.07493.x. Epub 2011 Oct 20. J Neurochem. 2011. PMID: 21933187 Free PMC article. - Cadmium activates the mitogen-activated protein kinase (MAPK) pathway via induction of reactive oxygen species and inhibition of protein phosphatases 2A and 5.
Chen L, Liu L, Huang S. Chen L, et al. Free Radic Biol Med. 2008 Oct 1;45(7):1035-44. doi: 10.1016/j.freeradbiomed.2008.07.011. Epub 2008 Jul 26. Free Radic Biol Med. 2008. PMID: 18703135 - Cadmium-induced apoptosis in primary rat cerebral cortical neurons culture is mediated by a calcium signaling pathway.
Yuan Y, Jiang CY, Xu H, Sun Y, Hu FF, Bian JC, Liu XZ, Gu JH, Liu ZP. Yuan Y, et al. PLoS One. 2013 May 31;8(5):e64330. doi: 10.1371/journal.pone.0064330. Print 2013. PLoS One. 2013. PMID: 23741317 Free PMC article. - New Insights into the Regulation of mTOR Signaling via Ca2+-Binding Proteins.
Amemiya Y, Maki M, Shibata H, Takahara T. Amemiya Y, et al. Int J Mol Sci. 2023 Feb 15;24(4):3923. doi: 10.3390/ijms24043923. Int J Mol Sci. 2023. PMID: 36835331 Free PMC article. Review. - Advances in the regulatory mechanisms of mTOR in necroptosis.
Xie Y, Zhao G, Lei X, Cui N, Wang H. Xie Y, et al. Front Immunol. 2023 Dec 18;14:1297408. doi: 10.3389/fimmu.2023.1297408. eCollection 2023. Front Immunol. 2023. PMID: 38164133 Free PMC article. Review.
Cited by
- Cadmium induces apoptosis in pancreatic β-cells through a mitochondria-dependent pathway: the role of oxidative stress-mediated c-Jun N-terminal kinase activation.
Chang KC, Hsu CC, Liu SH, Su CC, Yen CC, Lee MJ, Chen KL, Ho TJ, Hung DZ, Wu CC, Lu TH, Su YC, Chen YW, Huang CF. Chang KC, et al. PLoS One. 2013;8(2):e54374. doi: 10.1371/journal.pone.0054374. Epub 2013 Feb 6. PLoS One. 2013. PMID: 23405080 Free PMC article. - Heavy Metals Exposure and Alzheimer's Disease and Related Dementias.
Bakulski KM, Seo YA, Hickman RC, Brandt D, Vadari HS, Hu H, Park SK. Bakulski KM, et al. J Alzheimers Dis. 2020;76(4):1215-1242. doi: 10.3233/JAD-200282. J Alzheimers Dis. 2020. PMID: 32651318 Free PMC article. Review. - An overview on amyotrophic lateral sclerosis and cadmium.
Oggiano R, Pisano A, Sabalic A, Farace C, Fenu G, Lintas S, Forte G, Bocca B, Madeddu R. Oggiano R, et al. Neurol Sci. 2021 Feb;42(2):531-537. doi: 10.1007/s10072-020-04957-7. Epub 2020 Dec 5. Neurol Sci. 2021. PMID: 33280067 Free PMC article. Review. - Identification of a regulation network in response to cadmium toxicity using blood clam Tegillarca granosa as model.
Bao Y, Liu X, Zhang W, Cao J, Li W, Li C, Lin Z. Bao Y, et al. Sci Rep. 2016 Oct 20;6:35704. doi: 10.1038/srep35704. Sci Rep. 2016. PMID: 27760991 Free PMC article. - Neurotoxic Effect of Myricitrin in Copper-Induced Oxidative Stress Is Mediated by Increased Intracellular Ca2+ Levels and ROS/p53/p38 Axis.
Vlašić I, Krstačić-Galić A, Horvat A, Oršolić N, Sadžak A, Mandić L, Šegota S, Jazvinšćak Jembrek M. Vlašić I, et al. Antioxidants (Basel). 2025 Jan 3;14(1):46. doi: 10.3390/antiox14010046. Antioxidants (Basel). 2025. PMID: 39857380 Free PMC article.
References
- Waisberg M, Joseph P, Hale B, Beyersmann D. Molecular and cellular mechanisms of cadmium carcinogenesis. Toxicology. 2003;192:95–117. - PubMed
- Torra M, To-Figueras J, Rodamilans M, Brunet M, Corbella J. Cadmium and zinc relationships in the liver and kidney of humans exposed to environmental cadmium. Sci Total Environ. 1995;170:53–57. - PubMed
- Goering PL, Fisher BR, Kish CL. Stress protein synthesis induced in rat liver by cadmium precedes hepatotoxicity. Toxicol Appl Pharmacol. 1993;122:139–148. - PubMed
- Manca D, Ricard AC, Tra HV, Chevalier G. Relation between lipid peroxidation and inflammation in the pulmonary toxicity of cadmium. Arch Toxicol. 1994;68:364–369. - PubMed
- Shukla GS, Chiu J, Hart BA. Cadmium-induced elevations in the gene expression of the regulatory subunit of γ-glutamylcysteine synthetase in rat lung and alveolar epithelial cells. Toxicol. 2000;151:45–54. - PubMed
Publication types
MeSH terms
Substances
LinkOut - more resources
Full Text Sources
Research Materials
Miscellaneous


