Characterization of prefibrillar Tau oligomers in vitro and in Alzheimer disease - PubMed (original) (raw)
Characterization of prefibrillar Tau oligomers in vitro and in Alzheimer disease
Kristina R Patterson et al. J Biol Chem. 2011.
Abstract
Neurofibrillary tangles, composed of insoluble aggregates of the microtubule-associated protein Tau, are a pathological hallmark of Alzheimer disease (AD) and other tauopathies. However, recent evidence indicates that neuronal dysfunction precedes the formation of these insoluble fibrillar deposits, suggesting that earlier prefibrillar Tau aggregates may be neurotoxic. To determine the composition of these aggregates, we have employed a photochemical cross-linking technique to examine intermolecular interactions of full-length Tau in vitro. Using this method, we demonstrate that dimerization is an early event in the Tau aggregation process and that these dimers self-associate to form larger oligomeric aggregates. Moreover, using these stabilized Tau aggregates as immunogens, we generated a monoclonal antibody that selectively recognizes Tau dimers and higher order oligomeric aggregates but shows little reactivity to Tau filaments in vitro. Immunostaining indicates that these dimers/oligomers are markedly elevated in AD, appearing in early pathological inclusions such as neuropil threads and pretangle neurons as well as colocalizing with other early markers of Tau pathogenesis. Taken as a whole, the work presented herein demonstrates the existence of alternative Tau aggregates that precede formation of fibrillar Tau pathologies and raises the possibility that these hierarchical oligomeric forms of Tau may contribute to neurodegeneration.
Figures
FIGURE 1.
Cross-linking Tau aggregates with B4M cross-linkers. A, photochemical cross-linking was performed by incubating soluble Tau with B4M. Full-length Tau (hTau40) possesses two native cysteine (Cys) residues located in the 2nd and 3rd MTBRs. After conjugating the maleimide moiety of B4M to the native cysteines (Cys*), aggregation of Tau was induced using AA and the resultant Tau aggregates were cross-linked with short-wave UV light. Aggregation-competent Tau is depicted in the Alz-50 conformation in which the N terminus comes into close proximity of the MTBR region (35). Red circles indicate potential cross-linked sites. B, EM of aggregated Tau with no cross-linker and no UV treatment. Scale bar is 200 nm. C, EM of B4M-conjugated Tau UV irradiated for 5 min is morphologically identical to untreated Tau. D, Western blot of cross-linked Tau filaments and controls. Cross-linking of Tau aggregates reveals an apparent 180-kDa multimer, as well as larger cross-linked products. Note the background levels of the 180-kDa multimer in the absence of cross-linking. 500 ng of Tau was loaded per lane and blotted with R1. Results are representative of five independent experiments.
FIGURE 2.
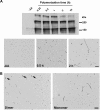
An apparent 180-kDa Tau oligomer is found in Alzheimer disease but not in controls. Whole homogenates (35 μg/lane) of frontal cortices obtained from 4 control and 4 AD brains were analyzed for the multimeric Tau species by Western blotting using polyclonal Tau antibody R1 (total Tau). Recombinant B4M cross-linked hTau40 (R) was run in parallel. In AD cases, multimeric Tau aggregates migrate at a similar _M_r to cross-linked recombinant Tau indicating that these aggregated species may be comparable in nature. Multimeric Tau aggregates were not observed in control cases. Additionally, the 180-kDa multimeric Tau aggregate was visible in AD cases when probed with Tau12 (N terminus) and Tau7 (C terminus), indicating that this species is not an amalgam of cleavage products of Tau monomers. Actin was used as a loading control.
FIGURE 3.
SELDI-TOF MS analysis reveals that the apparent 180-kDa cross-linked product is predominantly a dimer. A, cross-linked hTau40 aggregates were concentrated and separated by SDS-PAGE. Monomer and oligomer bands were extracted and electroeluted and then run on SDS-PAGE followed by staining with Coomassie Brilliant Blue R-250 to verify separation. B, SELDI-TOF MS analysis of Tau monomer reveals a peak at 47 kDa, the mass of hTau40. Additionally, minor peaks at 94 and 141 kDa were observed. C, SELDI-TOF MS analysis of the apparent 180-kDa cross-linked product reveals the prominent peak as 94 kDa, which corresponds to a dimer. Noticeably, a large Tau monomer peak is also present, likely representative of uncross-linked SDS-stable dimers that have since become dissociated. Monomer +2 charge peaks are denoted by arrows.
FIGURE 4.
Tau dimers associate to form oligomers but not long filaments. A, Tau was cross-linked at defined time points after the addition of AA. Note that dimer cross-linking saturates 0.25 h after the onset of aggregation. Corresponding EMs demonstrate that long filaments do not emerge until after dimer formation has already saturated. B, EMs of purified dimer (4 μ
m
total Tau equivalent to 2 μ
m
dimeric Tau) and monomer (2 μ
m
) 24 h after the addition of AA demonstrates that dimer aggregation produces mostly oligomers and a few short filaments (arrows). Conversely, electroeluted monomer forms long filaments in addition to oligomers when induced to aggregate with AA. Protein loading was 500 ng/lane blotted with R1. Scale bars in A and B are 200 nm.
FIGURE 5.
Characterization of the TOC1 monoclonal Ab. A, dot blot demonstrating TOC1 immunoreactivity. TOC1 preferentially labels uncross-linked Tau oligomeric and filamentous aggregates prepared with AA as opposed to unaggregated Tau (−AA). Moreover, TOC1 does not react with either α-synuclein (α_S_) or Aβ in the monomeric, oligomeric, or filamentous states. 45 ng/spot was applied to the nitrocellulose. Total Tau was determined using Tau12. B, quantification of TOC1 and Tau12 immunoreactivity at varying Tau concentrations. Whereas, Tau12 (gray dashed line) demonstrates a high affinity for both unaggregated (○) and aggregated (●) Tau, TOC1 (black solid line) reacts exclusively with Tau aggregates. Each point represents a minimum of three independent measurements. C, EMs of Tau oligomers and filaments (Tau Olig + Fil), α-synuclein oligomers and filaments (αS Olig + Fil), Aβ oligomers (Aβ Olig), and Aβ filaments (Aβ Fil) confirm the generation of aggregates of the appropriate morphology for each protein. Scale bar is 200 nm. D, TOC1 preferentially reacts with Tau dimers on dot blots. Monomeric and dimeric Tau were isolated from the same aggregation reaction. Also included is an electroeluted monomeric sample that was never exposed to AA (−AA). 12 ng/spot was applied to the nitrocellulose.
FIGURE 6.
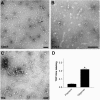
TOC1 preferentially labels Tau oligomers. A, TOC1 immunogold labeling reveals preferential labeling of oligomeric structures. However, labeling of the ends of a few filaments was observed as well (arrow). B, higher magnification of TOC1 immunogold labeling. C, immunogold labeling of the poly-His tag reveals abundant labeling of both Tau oligomers and filaments. D, quantification of TOC1 immunogold labeling of filaments (>50 nm) and oligomers (<50 nm) relative to His tag immunogold labeling of structures of the same category. *, p < 0.01, paired t test. Scale bars are 100 nm.
FIGURE 7.
Epitope mapping of TOC1. Deletion mutants of hTau40 were assembled with AA, spotted onto nitrocellulose, and probed with TOC1. A, schematic representations of the deletion mutants utilized. B, EM of wild type (WT), Δ9–155, Δ273–305, Δ144–273, Δ291–349, and Δ321–441 hTau40 was used to confirm the presence of aggregates. The morphological characteristics of the other deletion mutants are described elsewhere (30, 36, 37, 53). Scale bar is 500 nm. C, immunoreactivity of TOC1 to deletion mutants of hTau40 expressed as the ratio of TOC1:total Tau. Total Tau was measured with either Tau12 or a His probe antibody. Results are normalized to WT hTau40. Each bar represents the average of three independent experiments with the exception of MTBR (n = 2). The proposed discontinuous epitope of TOC1 consists of residues 155–244 (Site 1) and residues 376–421 (Site 2) and is represented schematically in panel A. *, p < 0.05; **, p < 0.01; ***, p < 0.001, one-way analysis of variance; ND, p value not determined. D, the discontinuous epitope of TOC1 and its preferential binding to dimeric over monomeric Tau are consistent with an antiparallel dimer conformation. The gray shaded box represents the MTBR, and the proposed TOC1 epitope is circled.
FIGURE 8.
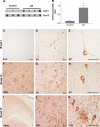
TOC1 immunoreactivity is elevated in AD. A, TOC1 preferentially labels Tau in AD brains compared with that from controls in non-denaturing conditions on dot blots (580 ng/spot) indicating that Tau in the TOC1 conformation is more abundant in AD. B, quantification of TOC1 labeling in extracts from the frontal cortex of control and AD brains in A represented as TOC1:Tau12 ratios. *, p < 0.01, unpaired t test. C, as expected, the superior temporal gyrus (STG) does not contain TOC1 immunoreactive Tau pathology in control cases (Braak I and II). D, in the entorhinal cortex (EC) of control cases, TOC1 labels early pretangle neurons with staining extending into both apical and basal dendritic processes. In addition, neuropil threads are labeled with TOC1. E, higher magnification of TOC1-labeled pretangle neuron in the EC from a control case reveals that these neurons do not contain mature compact NFTs. F, TOC1 labels abundant pathology in the STG of AD cases (Braak V and VI), including neuropil threads, neuritic plaques, as well as pretangle and tangle-bearing neurons. G, in the EC of AD cases, TOC1 labels similar pathology in addition to neurons that have lost their dendritic processes indicating that they are further along in the process of tangle evolution. H, higher magnification of TOC1 staining of the EC in AD. I, low magnification TOC1 immunostaining of the hippocampus of an AD case. J, TOC1 immunostaining in the CA1 region of the hippocampus in AD reveals flame-shaped inclusions within pyridimal neurons that are characteristic of this region. K, higher magnification of TOC1 immunolabeling of a neuritic plaque and pyramidal neurons in the CA1 region of an AD case. Scale bars are 50 μm.
FIGURE 9.
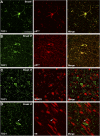
TOC1 immunoreactivity colocalizes with early markers of Tau pathology. A and B, laser scanning confocal microscopy was used to determine the degree of colocalization between TOC1 (green) and pS422 (red) in the entorhinal cortex. Colocalization between the two antibodies was almost complete in both control (A) and AD (B) cases, indicating that formation of the TOC1 epitope correlates with phosphorylation of Ser422, an early event in AD pathogenesis. C, immunofluorescence was performed using TOC1 (green) and MN423 (red) in severe AD cases. Very little colocalization was observed. D, in severe AD cases, TOC1 and TR did not colocalize, indicating that the TOC1 epitope precedes β-sheet formation characteristic of NFTs. Although occasional inclusions with both TOC1 and TR exist (arrow), different portions of the cell are labeled by each. Scale bar is 50 μm.
Similar articles
- Granular tau oligomers as intermediates of tau filaments.
Maeda S, Sahara N, Saito Y, Murayama M, Yoshiike Y, Kim H, Miyasaka T, Murayama S, Ikai A, Takashima A. Maeda S, et al. Biochemistry. 2007 Mar 27;46(12):3856-61. doi: 10.1021/bi061359o. Epub 2007 Mar 6. Biochemistry. 2007. PMID: 17338548 - Tau oligomers and tau toxicity in neurodegenerative disease.
Ward SM, Himmelstein DS, Lancia JK, Binder LI. Ward SM, et al. Biochem Soc Trans. 2012 Aug;40(4):667-71. doi: 10.1042/BST20120134. Biochem Soc Trans. 2012. PMID: 22817713 Free PMC article. Review. - Novel drugs affecting tau behavior in the treatment of Alzheimer's disease and tauopathies.
Navarrete LP, Pérez P, Morales I, Maccioni RB. Navarrete LP, et al. Curr Alzheimer Res. 2011 Sep;8(6):678-85. doi: 10.2174/156720511796717122. Curr Alzheimer Res. 2011. PMID: 21605038 Review. - Tauopathies and tau oligomers.
Takashima A. Takashima A. J Alzheimers Dis. 2013;37(3):565-8. doi: 10.3233/JAD-130653. J Alzheimers Dis. 2013. PMID: 23948895 Review. - Purification and Characterization of Low-n Tau Oligomers.
Kaniyappan S, Chandupatla RR, Mandelkow E. Kaniyappan S, et al. Methods Mol Biol. 2018;1779:99-111. doi: 10.1007/978-1-4939-7816-8_8. Methods Mol Biol. 2018. PMID: 29886530
Cited by
- Biochemical approaches to assess the impact of post-translational modifications on pathogenic tau conformations using recombinant protein.
Alhadidy MM, Kanaan NM. Alhadidy MM, et al. Biochem Soc Trans. 2024 Feb 28;52(1):301-318. doi: 10.1042/BST20230596. Biochem Soc Trans. 2024. PMID: 38348781 Free PMC article. Review. - Tau Trimers Are the Minimal Propagation Unit Spontaneously Internalized to Seed Intracellular Aggregation.
Mirbaha H, Holmes BB, Sanders DW, Bieschke J, Diamond MI. Mirbaha H, et al. J Biol Chem. 2015 Jun 12;290(24):14893-903. doi: 10.1074/jbc.M115.652693. Epub 2015 Apr 17. J Biol Chem. 2015. PMID: 25887395 Free PMC article. - Temporal progression of tau pathology and neuroinflammation in a rhesus monkey model of Alzheimer's disease.
Beckman D, Diniz GB, Ott S, Hobson B, Chaudhari AJ, Muller S, Chu Y, Takano A, Schwarz AJ, Yeh CL, McQuade P, Chakrabarty P, Kanaan NM, Quinton MS, Simen AA, Kordower JH, Morrison JH. Beckman D, et al. Alzheimers Dement. 2024 Aug;20(8):5198-5219. doi: 10.1002/alz.13868. Epub 2024 Jun 21. Alzheimers Dement. 2024. PMID: 39030748 Free PMC article. - Characteristics of TBS-extractable hyperphosphorylated tau species: aggregation intermediates in rTg4510 mouse brain.
Sahara N, DeTure M, Ren Y, Ebrahim AS, Kang D, Knight J, Volbracht C, Pedersen JT, Dickson DW, Yen SH, Lewis J. Sahara N, et al. J Alzheimers Dis. 2013;33(1):249-63. doi: 10.3233/JAD-2012-121093. J Alzheimers Dis. 2013. PMID: 22941973 Free PMC article. - Functional screening of Alzheimer risk loci identifies PTK2B as an in vivo modulator and early marker of Tau pathology.
Dourlen P, Fernandez-Gomez FJ, Dupont C, Grenier-Boley B, Bellenguez C, Obriot H, Caillierez R, Sottejeau Y, Chapuis J, Bretteville A, Abdelfettah F, Delay C, Malmanche N, Soininen H, Hiltunen M, Galas MC, Amouyel P, Sergeant N, Buée L, Lambert JC, Dermaut B. Dourlen P, et al. Mol Psychiatry. 2017 Jun;22(6):874-883. doi: 10.1038/mp.2016.59. Epub 2016 Apr 26. Mol Psychiatry. 2017. PMID: 27113998 Free PMC article.
References
- Braak H., Braak E. (1991) Acta Neuropathol. 82, 239–259 - PubMed
- Arriagada P. V., Growdon J. H., Hedley-Whyte E. T., Hyman B. T. (1992) Neurology 42, 631–639 - PubMed
- Roberson E. D., Scearce-Levie K., Palop J. J., Yan F., Cheng I. H., Wu T., Gerstein H., Yu G. Q., Mucke L. (2007) Science 316, 750–754 - PubMed
Publication types
MeSH terms
Substances
Grants and funding
- T32 AG020506/AG/NIA NIH HHS/United States
- S10 RR19325/RR/NCRR NIH HHS/United States
- AG09466/AG/NIA NIH HHS/United States
- S10 RR019325/RR/NCRR NIH HHS/United States
- C76 HF03610-01-00/PHS HHS/United States
- T32 AF020506/AF/ACF HHS/United States
- P01 AG009466/AG/NIA NIH HHS/United States
LinkOut - more resources
Full Text Sources
Other Literature Sources
Medical
Research Materials
Miscellaneous


