Akt2 regulates all Akt isoforms and promotes resistance to hypoxia through induction of miR-21 upon oxygen deprivation - PubMed (original) (raw)
Akt2 regulates all Akt isoforms and promotes resistance to hypoxia through induction of miR-21 upon oxygen deprivation
Christos Polytarchou et al. Cancer Res. 2011.
Abstract
The growth and survival of tumor cells in an unfavorable hypoxic environment depend upon their adaptability. Here, we show that both normal and tumor cells expressing the protein kinase Akt2 are more resistant to hypoxia than cells expressing Akt1 or Akt3. This is due to the differential regulation of microRNA (miR) 21, which is upregulated by hypoxia only in Akt2-expressing cells. By upregulating miR-21 upon oxygen deprivation, Akt2 downregulates PTEN and activates all three Akt isoforms. miR-21 also targets PDCD4 and Sprouty 1 (Spry1), and the combined downregulation of these proteins with PTEN is sufficient to confer resistance to hypoxia. Furthermore, the miR-21 induction by Akt2 during hypoxia depends upon the binding of NF-κB, cAMP responsive element-binding protein (CREB), and CBP/p300 to the miR-21 promoter, in addition to the regional acetylation of histone H3K9, all of which are under the control of Akt2. Analysis of the Akt2/miR-21 pathway in hypoxic MMTV-PyMT-induced mouse mammary adenocarcinomas and human ovarian carcinomas confirmed the activity of the pathway in vivo. Taken together, this study identifies a novel Akt2-dependent pathway that is activated by hypoxia and promotes tumor resistance via induction of miR-21.
©2011 AACR.
Figures
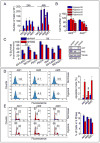
Figure 1. Akt2-expressing cells are more resistant to hypoxia, than Akt1- or Akt3-expressing cells
(A) Numbers of Akt1, Akt2, or Akt3-expressing cells surviving hypoxia. Data are expressed as mean ± SD. Asterisk indicates statistically significant difference between Akt2 and Akt1 or Akt3-expressing cells in hypoxia (*P<0.05). (B) Numbers of _Akt2_−/− and Akt2+/+ MEFs surviving hypoxia. Data are expressed as mean ± SD. Asterisk indicates statistically significant difference between _Akt2_−/− and Akt2+/+ MEFs in hypoxia (*P<0.05). (C) Ratios of live tumor cells in hypoxia vs normoxia. Data are expressed as mean ratios ± SD × 100 (Left panel). Lysates of shAkt1 and shAkt2-tranduced MDA-MB 231 cells probed for Akt1, Akt2, tubulin (Right). Asterisk indicates statistically significant difference between Akt2 and Akt1 or Akt3-expressing cells in hypoxia (*P<0.05). (D) TUNEL assay carried out on cells cultured in hypoxia or normoxia (Left). Mean percentage of apoptotic cells ± SD. Cummulative data of 4 experiments (Right). (E) Cell cycle distribution 24 hours after exposure to hypoxia (Left). Data show the mean percentage of cells in S phase ± SD. Cummulative data of 8 experiments (Right).
Figure 2. The resistance of Akt2-expressing cells to hypoxia depends on miR-21
(A) miR-21 levels in TKO lung fibroblasts and their derivatives expressing individual Akt isoforms (Upper), and in MEFs of the indicated genotypes (Lower), were measured by real time RT-PCR. Values are expressed as mean ± SD. Asterisk indicates statistically significant differences (*P<0.05). (B) Effect of anti-miR-21 on the number of live cells in cultures exposed to hypoxia for 48 hours (Upper). Effect of pre-miR-21 on the number of MEFs of the indicated genotypes exposed to hypoxia (Lower). Data are expressed as mean ± SD. Asterisk indicates statistically significant differences (*P<0.05). (C) Numbers of apoptotic Akt1, Akt2, and Akt3-expressing cells transduced with anti-miR-21 and cultured in hypoxia for 24 hours. Representative experiment (Left) and cumulative data from 3 experiments (Right) expressed as mean ± SD. Asterisk indicates statistically significant difference between control and as-miR-21 transfected Akt2-expressing cells (*P<0.05). (D) Cell cycle distribution before and after exposure to hypoxia. Representative experiment (Left) and cumulative data (Right) expressed as mean ± SD.
Figure 3. The Akt2/miR-21/PTEN pathway is a master regulator of all Akt isoforms in cells growing in hypoxia
(A) PTEN protein levels and Akt activity in immortalized TKO lung fibroblasts and their derivatives expressing Akt1, Akt2, or Akt3, before and after oxygen deprivation. (B) PTEN protein levels and Akt activity in _Akt2_−/− and Akt2+/+ MEFs, before and after oxygen deprivation. (C) Anti-miR-21 inhibits the downregulation of PTEN by hypoxia in Akt2-expressing lung fibroblasts (Upper). Pre-miR-21 promotes the downregulation of PTEN by hypoxia in both Akt2+/+ and _Akt2_−/− MEFs (Lower). Lysates of the transfected cells cultured in hypoxia for 24 hours probed with the indicated antibodies. (D) Akt2 promotes the activation of both Akt1 and Akt2 in cells exposed to hypoxia. TKO lung fibroblasts were transduced with myc.Akt1, HA.Akt2, both (Akt1-2) or the empty vector MigR1 (EV), were grown in normoxia or hypoxia and harvested 24 hours later. Probing Akt2 (HA) immunoprecipitates with the anti-phospho-Thr308 and the anti-phospho-Ser473 antibodies showed that phosphorylation of Akt2 at both sites in Akt2 and Akt1-2-transduced cells grown in hypoxia is equal (Left). Probing Akt1 (myc) immunoprecipitates showed that its phosphorylation at both sites is higher in Akt1-2- than in Akt1-transduced cells grown in hypoxia (Right).
Figure 4. Akt2 downregulates PDCD4 and Spry1 via miR-21 in hypoxia. The combined downregulation of PTEN, PDCD4 and Spry1 is sufficient to induce resistance to hypoxia
(A) Akt2 promotes the downregulation of PTEN, PDCD4 and Spry1 in cells exposed to hypoxia. Lysates of cells cultured in normoxia or hypoxia for 24 hours probed with the indicated antibodies. (B) Akt2 ablation interferes with the downregulation of PTEN, PDCD4 and Spry1 in MEFs exposed to hypoxia. Lysates of MEFs of the indicated genotypes probed with the indicated antibodies. (C) Anti-miR-21 inhibits the downregulation of PDCD4 and Spry1 in Akt2-expressing cells. Lysates of cells transfected with anti-miR-21 and cultured in hypoxia were probed with the indicated antibodies. (D) Pre-miR-21 promotes the downregulation of PDCD4 and Spry1 and the activation of ERK in _Akt2_−/− MEFs exposed to hypoxia. MEFs transfected with pre-miR-21 were cultured in hypoxia. Cell lysates harvested 24 hours later probed with the indicated antibodies. (E) Knockdown of PTEN, PDCD4 and Spry1. Akt1- or Akt2-expressing lung fibroblasts were transfected with the indicated siRNAs. Cell lysates harvested 48 hours after the transfection were probed with the indicated antibodies. (F) The cells in E were grown in normoxia or hypoxia. Cell numbers, after 24 hours in hypoxia, expressed as mean ± SD (combined results from 2 experiments performed in quadruplicate). Asterisk indicates statistically significant difference in cell numbers between hypoxia-treated Akt1-expressing cells transfected with all three siRNAs or siRNA Control (*P<0.05).
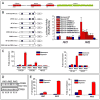
Figure 5. Selective miR-21 promoter binding of CREB, CBP and NF-κB and selective histone H3K9 acetylation in the miR-21 promoter in Akt2-expressing cells exposed to hypoxia
(A) Schematic diagram of the promoter of miR-21. Red boxes: binding sites for CREB and NF-κB; Green box: miR-21 gene. (B) MiR-21 promoter activity in Akt1-, and Akt2-expressing cells cultured in hypoxia for 24 hours. Schematic diagram of the wild type reporter gene vector and its point mutants (Left) and luciferase assay (Right). Relative luciferase activity was set to 1 in Akt1-expressing cells growing in normoxia. Data are expressed as mean ± SD. (C) Chromatin Immunoprecipitation for CREB and NF-κB in Akt1-, and Akt2-expressing cells growing under normoxic or hypoxic conditions. The binding of CREB (Left) and NF-κB (Right) was measured by real time PCR. Data are expressed as mean ± SD. (D) CREB phosphorylation in Akt1-, Akt2-, or Akt3-expressing cells upon oxygen deprivation. (E) Chromatin Immunoprecipitation for CBP and H3K9 acetylation in Akt1-, and Akt2-expressing cells. The fold enrichment of CBP binding (Left) and H3K9Ac (Right) to the promoter of miR-21, was measured by real time PCR. Data are expressed as mean ± SD.
Figure 6. The Akt2-miR21 pathway is active in hypoxic tumors
(A) Expression of miR-21 and its targets in mammary adenocarcinomas in HIF-1α-expressing MMTV-PyMT/Akt+/+, MMTV-PyMT/_Akt1_−/− and MMTV-Pymt/_Akt2_−/− mice. Relative miR-21 levels were measured by real time RT-PCR, with U6 small nuclear RNA as the internal control. Data are expressed as mean ± SD (n=4–5 animals per group). PTEN, PDCD4 and Spry1 levels were analyzed by western blotting. α-Tubulin was used as a loading control. The intensity of the bands was quantified using Scion Image software. Data are expressed as mean ± SD (n=4–5 animals per group). (B) Immunohistochemistry for HIF-1α and in situ hybridization for miR-21 in tumors arising in MMTV-PyMT/Akt+/+ and MMTV-Pymt/_Akt2_−/− mice (Left). The great majority of hypoxic (HIF-1α+) focal areas in tumors arising in _Akt2_−/− mice express low levels of miR-21 (Right). (C) Expression of Akt2, miR-21 and PTEN in human ovarian carcinomas. Samples classified into two groups expressing high and low HIF-1α were analyzed for Akt2, miR-21 and PTEN levels. Blue dots represent tumors with low levels of Akt2 and red dots represent tumors with high levels of Akt2.
Figure 7. Proposed model
In normoxia, Akt promotes cell survival and proliferation (blue line). Differential activation of NF-κB and CREB/CBP by hypoxia, via Akt2, activates a miR-21-dependent pathway which confers resistance to hypoxia.
Similar articles
- MicroRNA-21 regulates the ERK/NF-κB signaling pathway to affect the proliferation, migration, and apoptosis of human melanoma A375 cells by targeting SPRY1, PDCD4, and PTEN.
Mao XH, Chen M, Wang Y, Cui PG, Liu SB, Xu ZY. Mao XH, et al. Mol Carcinog. 2017 Mar;56(3):886-894. doi: 10.1002/mc.22542. Epub 2016 Sep 22. Mol Carcinog. 2017. PMID: 27533779 - MicroRNA-29B (mir-29b) regulates the Warburg effect in ovarian cancer by targeting AKT2 and AKT3.
Teng Y, Zhang Y, Qu K, Yang X, Fu J, Chen W, Li X. Teng Y, et al. Oncotarget. 2015 Dec 1;6(38):40799-814. doi: 10.18632/oncotarget.5695. Oncotarget. 2015. PMID: 26512921 Free PMC article. - Distinct biological roles for the akt family in mammary tumor progression.
Dillon RL, Muller WJ. Dillon RL, et al. Cancer Res. 2010 Jun 1;70(11):4260-4. doi: 10.1158/0008-5472.CAN-10-0266. Epub 2010 Apr 27. Cancer Res. 2010. PMID: 20424120 Free PMC article. Review. - Triangle of AKT2, miRNA, and Tumorigenesis in Different Cancers.
Honardoost M, Rad SMAH. Honardoost M, et al. Appl Biochem Biotechnol. 2018 Jun;185(2):524-540. doi: 10.1007/s12010-017-2657-3. Epub 2017 Dec 4. Appl Biochem Biotechnol. 2018. PMID: 29199386 Review.
Cited by
- Tick-Borne Flaviviruses Depress AKT Activity during Acute Infection by Modulating AKT1/2.
Kirsch JM, Mlera L, Offerdahl DK, VanSickle M, Bloom ME. Kirsch JM, et al. Viruses. 2020 Sep 23;12(10):1059. doi: 10.3390/v12101059. Viruses. 2020. PMID: 32977414 Free PMC article. - Potential epigenetic molecular regulatory networks in ocular neovascularization.
Hu Q, Zhang X, Sun M, Jiang B, Zhang Z, Sun D. Hu Q, et al. Front Genet. 2022 Sep 2;13:970224. doi: 10.3389/fgene.2022.970224. eCollection 2022. Front Genet. 2022. PMID: 36118885 Free PMC article. Review. - Targeting ROR1 inhibits epithelial-mesenchymal transition and metastasis.
Cui B, Zhang S, Chen L, Yu J, Widhopf GF 2nd, Fecteau JF, Rassenti LZ, Kipps TJ. Cui B, et al. Cancer Res. 2013 Jun 15;73(12):3649-60. doi: 10.1158/0008-5472.CAN-12-3832. Cancer Res. 2013. PMID: 23771907 Free PMC article. - Akt1 and Akt2 protein kinases differentially contribute to macrophage polarization.
Arranz A, Doxaki C, Vergadi E, Martinez de la Torre Y, Vaporidi K, Lagoudaki ED, Ieronymaki E, Androulidaki A, Venihaki M, Margioris AN, Stathopoulos EN, Tsichlis PN, Tsatsanis C. Arranz A, et al. Proc Natl Acad Sci U S A. 2012 Jun 12;109(24):9517-22. doi: 10.1073/pnas.1119038109. Epub 2012 May 30. Proc Natl Acad Sci U S A. 2012. PMID: 22647600 Free PMC article. - Hypoxia: a master regulator of microRNA biogenesis and activity.
Nallamshetty S, Chan SY, Loscalzo J. Nallamshetty S, et al. Free Radic Biol Med. 2013 Sep;64:20-30. doi: 10.1016/j.freeradbiomed.2013.05.022. Epub 2013 May 24. Free Radic Biol Med. 2013. PMID: 23712003 Free PMC article. Review.
References
- Harris AL. Hypoxia--a key regulatory factor in tumour growth. Nat Rev Cancer. 2002;2:38–47. - PubMed
- Semenza GL. Regulation of cancer cell metabolism by hypoxia-inducible factor 1. Semin Cancer Biol. 2009;19:12–6. - PubMed
Publication types
MeSH terms
Substances
LinkOut - more resources
Full Text Sources
Other Literature Sources
Medical
Molecular Biology Databases
Research Materials
Miscellaneous


