Regulated offloading of cytoplasmic dynein from microtubule plus ends to the cortex - PubMed (original) (raw)
Regulated offloading of cytoplasmic dynein from microtubule plus ends to the cortex
Steven M Markus et al. Dev Cell. 2011.
Abstract
Cytoplasmic dynein mediates spindle orientation from the cell cortex through interactions with astral microtubules, but neither the mechanism governing its cortical targeting nor the regulation thereof is well understood. Here we show that yeast dynein offloads from microtubule plus ends to the daughter cell cortex. Mutants with an engineered peptide inserted between the tail domain and the motor head retain wild-type motor activity but exhibit enhanced offloading and cortical targeting. Conversely, shortening the "neck" sequence between the tail and motor domains precludes offloading from the microtubule plus ends. Furthermore, chimeric mutants with mammalian dynein "neck" sequences rescue targeting and function. These findings provide direct support for an active microtubule-mediated delivery process that appears to be regulated by a conserved masking/unmasking mechanism.
Copyright © 2011 Elsevier Inc. All rights reserved.
Figures
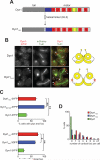
Figure 1. Insertion of a helical peptide (HL3) between the tail and motor domains of Dyn1 enhances its plus end and cortical targeting
(A) Schematic representation of Dyn1 and the Dyn1HL3 mutant, with domain structure of Dyn1 indicated (blue region, ‘linker’ domain defined by in vitro studies (Reck-Peterson et al., 2006); red regions, six AAA domains (Mocz and Gibbons, 2001); green regions, anti-parallel coiled coils of the stalk; yellow region, MT-binding domain (Gee et al., 1997)). (B) Cells expressing mCherry-Tub1 and either wild-type Dyn1-3YFP (top) or Dyn1HL3-3YFP (bottom). Open arrowheads, SPB foci; closed arrowheads, cortical foci; arrows, plus end foci. Each image is a maximum intensity projection of a 2-μm Z-stack of wide-field images. (C) The percentage of cells that exhibit plus end (top) or cortical (bottom) fluorescent foci is plotted for strains expressing mCherry-Tub1 with Dyn1-3YFP, Dyn1HL3-3YFP, Dyn1MOTOR-3YFP, or Dyn1TAIL-3GFP. Stationary cortical foci and motile plus end foci were identified in two-color movies and scored accordingly. Error bars represent standard error of proportion (n ≥ 120 cells; *p = 0.0278; **p < 0.0001). (D) The percentage of cells exhibiting the indicated number of cortical fluorescent foci is plotted for strains expressing mCherry-Tub1 with Dyn1-3GFP, Dyn1HL3-3YFP or Dyn1TAIL-3GFP.
Figure 2. Association of Dyn1HL3 with the cell cortex occurs independently of plus end targeting
(A – B) The percentage of cells that exhibit (A) plus end or (B) cortically associated Dyn1HL3-3YFP foci is plotted for wild-type (WT) and indicated null strains (n ≥ 105 cells). Stationary cortical or motile plus end foci were identified in two-color movies and scored accordingly. Error bars represent standard error of proportion. (C) Representative images of _pac1_Δ or _bik1_Δ cells expressing mCherry-Tub1 and Dyn1HL3-3YFP used for quantitation in panels (A) and (B). Closed arrowhead indicates cortical Dyn1HL3-3YFP foci. Each image is a maximum intensity projection of a 2-μm Z-stack of wide-field images.
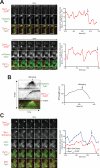
Figure 3. Direct observation of Dyn1HL3 offloading from MT plus end to the cell cortex
(A) Representative movie frames of cells expressing Dyn1HL3-3YFP and mCherry-Tub1. Arrowhead, offloaded Dyn1HL3; arrow, MT plus end following offloading event. Graphs depict fluorescence intensity of plus end-associated Dyn1HL3-3YFP at the moments preceding and directly following an offloading event (vertical arrow). Each image is a maximum intensity projection of a 2-μm Z-stack of wide-field images. Also see Video S3 and Fig. S3C. (B) Kymograph depicting a Dyn1HL3 offloading event and a life history plot of the same MT leading up to and immediately following the offloading event (also see Fig. S3D). Merge image in kymograph shows mCherry-Tub1 in green and Dyn1HL3-3YFP in red. MT lengths were measured using ImageJ from two-dimensional projections of 2-μm Z-stacks of wide-field fluorescence images. The time at which offloading occurred is indicated on the kymograph and the life history plot by the vertical arrow. (C) Similar to (A) but with cells expressing Dyn1HL3-3YFP, Bik1-3mCherry and CFP-Tub1. Graph depicts fluorescence intensity of plus end-associated Dyn1HL3-3YFP (red) and Bik1-3mCherry (blue). Also see Video S5, top.
Figure 4. Direct observation of wild-type Dyn1 offloading from MT plus end to the cell cortex
(A) Representative movie frames of _she1_Δ cells expressing Dyn1-3YFP and mCherry-Tub1. Arrowhead, offloaded Dyn1; arrow, MT plus end following offloading event. Graphs depict fluorescence intensity of plus end-associated Dyn1-3YFP at the moments preceding and directly following an offloading event (vertical arrow). Each image is a maximum intensity projection of a 2-μm Z-stack of wide-field images. Also see Video S4.
Figure 5. In vivo functional assessment of Dyn1 neck mutants
The percentage of cells with a misoriented mitotic spindle in a cold (16°C) spindle position assay (Lee et al., 2005; Li et al., 2005) is plotted for haploid strains carrying DYN1-3YFP (indicated as DYN1), _dyn1_Δ, _dyn1_Δ _pac1_Δ, dyn1HL3-3YFP (indicated as dyn1HL3), _dyn1HL3-3YFP pac1_Δ, _dyn1_Δ_20_-3YFP (indicated as dyn1_Δ_20), and _dyn1_Δ_20_-_3YFP pac1_Δ. Spindles were visualized using mCherry-Tub1. Strains were imaged after growth at 16°C to mid-log in synthetic defined media lacking methionine (to induce mCherry-Tub1 expression controlled by the MET3 promoter). Error bars represent standard error of proportion (n ≥ 184 cells for each strain). Student's t-test was used to calculate p values.
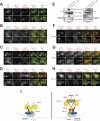
Figure 6. Dyn1HL3 expressing cells exhibit ectopic cortical Dyn3, Pac1, Bik1 and Kip2
(A – D) Wide-field fluorescence images of dyn1HL3-3YFP cells expressing (A) Dyn3-3mCherry, (B) Pac1-3mCherry, (C) Bik1-3mCherry, or (D) Kip2-mCherry. (E) TAP-tagged Dyn1HL3-GFP pulls down more Pac1-13myc compared to wild-type Dyn1-GFP, in the presence (left; BIK1) and absence (_right; bik1_Δ) of Bik1. Equal amounts of protein lysate were incubated with S-protein agarose. Bound proteins were released by TEV protease digestion and immunoblotted with rabbit IgG (for ZZ-Dyn1-GFP or ZZ-Dyn1HL3-GFP) or anti-c-Myc (for Pac1-13myc). The yield of ZZ-Dyn1HL3-GFP from cell lysate was consistently less than that for wild-type ZZ-Dyn1-GFP (left, middle and right lanes; also see Fig. S1D). Upon deletion of Bik1 (right) or Pac1 (not shown), recovery of ZZ-Dyn1HL3-GFP was improved to a level comparable to that for wild-type ZZ-Dyn1-GFP. (F – G) Cortical Bik1 is lost in _dyn1HL3-3YFP pac1_Δ cells, but Pac1 is retained at the cortex in _dyn1HL3-3YFP bik1_Δ cells. (H) Colocalization of the dynactin subunit dynamitin Jnm1 with cortical Dyn1HL3 in _pac1_Δ cells. All images are maximum intensity projections of a 2-μm Z-stack of wide-field fluorescence images. Open arrowheads, SPB foci; closed arrowheads, cortical foci; arrows, plus end foci. (I) Schematic drawings of wild-type (left) and Dyn1HL3 (right) cortical dynein complexes. Kip2, Bik1, Pac1, and Dyn3 (labeled in red) are not found at the cell cortex in wild-type cells.
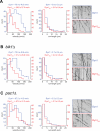
Figure 7. Dyn1HL3 isolated from cells lacking Pac1, but not Bik1, exhibits wild-type processive motility
Histograms of velocities and run lengths of Dyn1 (blue) or Dyn1HL3 (red) isolated from (A) wild-type, (B) _bik1_Δ or (C) _pac1_Δ strains are shown with representative kymographs from each. Single molecules of Dyn1-GFP or Dyn1HL3-GFP (see Fig. S6B and C) were visualized on taxol-stabilized rhodamine-labeled MTs using time-lapse TIRF microscopy. Mean velocities ± standard deviation, and run lengths (determined from exponential decay fits) ± standard error are shown for each. Only those dynein motors that moved with a velocity greater than zero were chosen for velocity and run length measurements. Also see Videos S6 and S7.
Figure 8. Differential targeting of dynein elicited by peptide insertion, deletion and substitution
(A) Schematic depicting construction of the Dyn1_Δ_20 mutant. (B) Representative wide-field fluorescence images of PAC1 (top) or _pac1_Δ (bottom) cells expressing mCherry-Tub1 and Dyn1Δ20-3YFP. Open arrowheads, SPB foci; arrows, plus end foci. (C) The percentage of cells that exhibit cortical fluorescent foci is plotted for strains expressing mCherry-Tub1 with Dyn1-3YFP, Dyn1HL3-3YFP, Dyn1Ala-3YFP, or Dyn1Δ20-3YFP. Stationary cortical foci were identified in two-color movies and scored accordingly. Error bars represent standard error of proportion (n ≥ 69 cells; *p < 0.0001). (D) Schematic representation of the Dyn1rat10 and Dyn1rat20 mutants (see Fig. 1A for domain structure). (E) Representative wide-field fluorescence images of cells expressing mCherry-Tub1 and either Dyn1rat10-3YFP (top) or Dyn1rat20-3YFP (bottom). Open arrowheads, SPB foci; closed arrowheads, cortical foci; arrows, plus end foci. Each image (in B and E) is a maximum intensity projection of a 2-μm Z-stack of wide-field images. (F) The percentage of cells with a misoriented mitotic spindle in a cold (16°C) spindle position assay is plotted for strains carrying DYN1 (wild-type), _dyn1_Δ, dyn1rat10-3YFP, or dyn1rat20-3YFP (n ≥ 217 cells for each strain). Error bars represent standard error of proportion.
Similar articles
- Cortical dynein controls microtubule dynamics to generate pulling forces that position microtubule asters.
Laan L, Pavin N, Husson J, Romet-Lemonne G, van Duijn M, López MP, Vale RD, Jülicher F, Reck-Peterson SL, Dogterom M. Laan L, et al. Cell. 2012 Feb 3;148(3):502-14. doi: 10.1016/j.cell.2012.01.007. Cell. 2012. PMID: 22304918 Free PMC article. - She1-mediated inhibition of dynein motility along astral microtubules promotes polarized spindle movements.
Markus SM, Kalutkiewicz KA, Lee WL. Markus SM, et al. Curr Biol. 2012 Dec 4;22(23):2221-30. doi: 10.1016/j.cub.2012.10.017. Epub 2012 Nov 8. Curr Biol. 2012. PMID: 23142046 Free PMC article. - The dynein cortical anchor Num1 activates dynein motility by relieving Pac1/LIS1-mediated inhibition.
Lammers LG, Markus SM. Lammers LG, et al. J Cell Biol. 2015 Oct 26;211(2):309-22. doi: 10.1083/jcb.201506119. Epub 2015 Oct 19. J Cell Biol. 2015. PMID: 26483554 Free PMC article. - Regulation of processive motion and microtubule localization of cytoplasmic dynein.
Jha R, Surrey T. Jha R, et al. Biochem Soc Trans. 2015 Feb;43(1):48-57. doi: 10.1042/BST20140252. Biochem Soc Trans. 2015. PMID: 25619245 Review. - LIS1 at the microtubule plus end and its role in dynein-mediated nuclear migration.
Xiang X. Xiang X. J Cell Biol. 2003 Feb 3;160(3):289-90. doi: 10.1083/jcb.200212168. J Cell Biol. 2003. PMID: 12566423 Free PMC article. Review.
Cited by
- Regulation of mitotic spindle orientation: an integrated view.
di Pietro F, Echard A, Morin X. di Pietro F, et al. EMBO Rep. 2016 Aug;17(8):1106-30. doi: 10.15252/embr.201642292. Epub 2016 Jul 18. EMBO Rep. 2016. PMID: 27432284 Free PMC article. Review. - Num1 versus NuMA: insights from two functionally homologous proteins.
Greenberg SR, Tan W, Lee WL. Greenberg SR, et al. Biophys Rev. 2018 Dec;10(6):1631-1636. doi: 10.1007/s12551-018-0472-x. Epub 2018 Nov 6. Biophys Rev. 2018. PMID: 30402673 Free PMC article. Review. - Dynein, microtubule and cargo: a ménage à trois.
Pavin N, Tolić-Nørrelykke IM. Pavin N, et al. Biochem Soc Trans. 2013 Dec;41(6):1731-5. doi: 10.1042/BST20130235. Biochem Soc Trans. 2013. PMID: 24256283 Free PMC article. Review. - Lis1 relieves cytoplasmic dynein-1 autoinhibition by acting as a molecular wedge.
Karasmanis EP, Reimer JM, Kendrick AA, Nguyen KHV, Rodriguez JA, Truong JB, Lahiri I, Reck-Peterson SL, Leschziner AE. Karasmanis EP, et al. Nat Struct Mol Biol. 2023 Sep;30(9):1357-1364. doi: 10.1038/s41594-023-01069-6. Epub 2023 Aug 24. Nat Struct Mol Biol. 2023. PMID: 37620585 Free PMC article. - BICD2, dynactin, and LIS1 cooperate in regulating dynein recruitment to cellular structures.
Splinter D, Razafsky DS, Schlager MA, Serra-Marques A, Grigoriev I, Demmers J, Keijzer N, Jiang K, Poser I, Hyman AA, Hoogenraad CC, King SJ, Akhmanova A. Splinter D, et al. Mol Biol Cell. 2012 Nov;23(21):4226-41. doi: 10.1091/mbc.E12-03-0210. Epub 2012 Sep 5. Mol Biol Cell. 2012. PMID: 22956769 Free PMC article.
References
- Arai R, Ueda H, Kitayama A, Kamiya N, Nagamune T. Design of the linkers which effectively separate domains of a bifunctional fusion protein. Protein Eng. 2001;14:529–532. - PubMed
- Burgess SA, Walker ML, Sakakibara H, Knight PJ, Oiwa K. Dynein structure and power stroke. Nature. 2003;421:715–718. - PubMed
- Burgess SA, Walker ML, Sakakibara H, Oiwa K, Knight PJ. The structure of dynein-c by negative stain electron microscopy. J Struct Biol. 2004;146:205–216. - PubMed
Publication types
MeSH terms
Substances
LinkOut - more resources
Full Text Sources
Molecular Biology Databases
Research Materials


