Elevated miR-499 levels blunt the cardiac stress response - PubMed (original) (raw)
Elevated miR-499 levels blunt the cardiac stress response
Joseph T C Shieh et al. PLoS One. 2011.
Abstract
Background: The heart responds to myriad stresses by well-described transcriptional responses that involve long-term changes in gene expression as well as more immediate, transient adaptations. MicroRNAs quantitatively regulate mRNAs and thus may affect the cardiac transcriptional output and cardiac function. Here we investigate miR-499, a microRNA embedded within a ventricular-specific myosin heavy chain gene, which is expressed in heart and skeletal muscle.
Methodology/principal findings: We assessed miR-499 expression in human tissue to confirm its potential relevance to human cardiac gene regulation. Using a transgenic mouse model, we found that elevated miR-499 levels caused cellular hypertrophy and cardiac dysfunction in a dose-dependent manner. Global gene expression profiling revealed altered levels of the immediate early stress response genes (Egr1, Egr2 and Fos), ß-myosin heavy chain (Myh7), and skeletal muscle actin (Acta1). We verified the effect of miR-499 on the immediate early response genes by miR-499 gain- and loss-of-function in vitro. Consistent with a role for miR-499 in blunting the response to cardiac stress, asymptomatic miR-499-expressing mice had an impaired response to pressure overload and accentuated cardiac dysfunction.
Conclusions: Elevated miR-499 levels affect cardiac gene expression and predispose to cardiac stress-induced dysfunction. miR-499 may titrate the cardiac response to stress in part by regulating the immediate early gene response.
Conflict of interest statement
Competing Interests: The authors have declared that no competing interests exist.
Figures
Figure 1. Human miR-499 is a conserved muscle-specific microRNA.
(A) microRNA expression in human fetal heart compared to liver. Positive log2 ratio values indicate cardiac enrichment. n = 3 independent RNA samples per group, dots with vertical line indicate mean ± standard deviation for each microRNA. (B) Alignment of genomic sequences corresponding to mature miR-499 in multiple species. (C) Northern blot with a miR-499 specific probe with RNA from 293T cells transfected with the genomic sequence surrounding the human or mouse miR-499 locus. Pre-miR and mature microRNA bands are visible. (D) Mature miR-499 was expressed in human heart and skeletal muscle as detected by Northern blot; U6 small nuclear RNA was probed as a loading control. RNA from miR-499 transfected 293T cells or control vector-transfected cells was used as positive or negative controls (ctrl). (E) Genomic organization of miR-499 in the myosin heavy chain gene of human MYH7B or mouse Myh7b adapted from the UCSC genome browser. The conserved intronic location of miR-499 is indicated between exons 20 and 21 in humans and exons 19 and 20 in mouse; arrows indicate the direction of transcription.
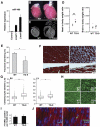
Figure 2. Characterization of hypertrophy phenotype in miR-499 transgenic mice.
(A) Cardiac miR-499 expression levels (mean ± standard deviation) in transgenic mouse lines compared to littermate controls. (B) Hearts from miR-499 transgenic mice (line #9, TG-9) were larger than those from littermate controls (6 weeks of age), n = 16 mice per group. (C) Coronal optical tomography section of miR-499 TG-9 heart demonstrated chamber enlargement compared to control. (D) Heart-to-body weight ratios of miR-499 transgenic (TG-9) or littermate control (WT) mice. Brain-to-body weight ratios are also shown. Data from individual mice are plotted as dots with the mean indicated by a horizontal bar. *P = 0.0002. (E) Fractional shortening measured by echocardiography of WT or TG-9 mice. *P = 0.00047, n = 8 mice for WT, 4 for TG. (F) Histological section of heart revealing area of fibrosis in TG-9 hearts compared to WT as shown by Masson trichrome staining in myocardium (upper panels) or beneath the endocardial surface (lower panels); magnification 400×. (G) Quantification of cardiomyocyte size from TG-9 mice compared to WT mice (RV, right ventricle, and LV, left ventricle, both *P<0.05; box plots depicts size distribution of over 300 cells per heart in each of two mice per group). (H) Wheat germ agglutinin (WGA) staining; magnification 200×. (I) TG-9 and WT heart demonstrated similar levels of apoptosis, n = 3 mice per group; representative stained histologic section (J) demonstrated the alpha-actinin staining (red) and DAPI-stained nuclei (blue) overlaid with TUNEL-positive nuclei (green, right panel).
Figure 3. Modest levels of miR-499 expression results in mild hypertrophy.
(A) Gross appearance of hearts from miR-499 transgenic mice (line #17, TG-17) and littermate controls (WT) was similar. (B) Heart-to-body weight ratios in TG-17 and WT, n = 4–6 mice per group. (C) Fractional shortening of WT or TG-17 mice by echocardiography. (D) WGA staining of histological sections of hearts from TG-17 and WT mice; magnification 200×. (E) Quantification of cardiomyocyte size revealed an increase in TG-17 (RV and LV both *P<0.05).
Figure 4. miR-499 targeting of Sox6.
(A) The 3′UTR of Sox6 was placed downstream of a luciferase reporter construct and tested for repression by miR-499 in 293T cells. Sox6 3′UTR-mediated repression increased as amounts of miR-499 was increased; this was not observed with miR-133 or when the UTR orientation was reversed, n = 3–4 transfections per condition, *P<0.05. (B) Western blots indicate protein levels in TG-9 or WT hearts using antibodies against Sox6, ß-myosin heavy chain (ß-MyHC), or Gapdh. Results are representative of three hearts each. (C) Cardiac expression of ß-myosin heavy chain (ß-MyHC) or Sox6 mRNA transcripts in TG lines and WT mice by qPCR, n = 3.
Figure 5. Altered cardiac transcripts from global analysis of miR-499 TG hearts.
(A) Expression microarray results depicting average log2 intensity of gene expression from post-natal day 17 WT hearts (x-axis) versus TG-17 hearts (y-axis). Each dot represents a single transcript from three miR-499 transgenic mice and three littermate controls. The dot indicated in red (arrow) represents miR-499 expression. (B) and (C) Gene expression alterations in miR-499 mice (top ten up- and downregulated genes). Egr1 and Fos were the most downregulated transcripts. Full expression data have been deposited in NCBI GEO. (D) qPCR validation of microarray results regarding the immediate early response gene transcripts Egr1, Egr2, and Fos. *P<0.05, n = 3 hearts per group with samples assessed in triplicate. Bars indicate mean with 95% confidence interval.
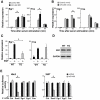
Figure 6. miR-499 blunts the induction of the immediate early response genes.
(A) Egr1 and Fos mRNA levels by qPCR relative to Gapdh in the ventricular cell line H9c2, upon introduction of a morpholino (MO) that blocks miR-499 generation or a control MO. (B) Egr1 and Fos mRNA levels by qPCR in H9c2 cells after the introduction of miR-499 or control mimic. The x-axis in (A) and (B) indicates the time after serum stimulation to activate the immediate early gene response; n = 3 per group. *P<0.05. (C) Egr1 or Fos mRNA levels in miR-499 TG-17 or WT hearts as assessed by qPCR 1.5 hours after _in vivo_ stimulation with epidermal growth factor (EGF). Bars indicate mean ± standard deviation; n>3 per group. *P<0.05. (D) Western blot indicates protein levels in TG-9 or WT hearts using SRF antibodies with Gapdh as loading control. Results are representative of three hearts each. (E) The 3′ UTR of Sox6, Egr1, Egr2, or Fos was placed downstream of a luciferase reporter construct and tested for repression by miR-499 in culture. Sox6 3′UTR-mediated repression by miR-499 was evident, however Egr1, Egr2, and Fos 3′UTRs were not repressed by miR-499 (n = 3 per condition, *P<0.05).
Figure 7. miR-499 elevation predisposes to stress-induced cardiac dysfunction in vivo.
(A) Following thoracic aortic banding (TAB), TG-17 hearts were slightly larger compared to banded WT hearts, and (B) the heart-to-body weight ratio was increased to a greater degree in TG-17 compared to similarly banded WT controls (n = 4–5 per group, *P<0.05). (C) Fractional shortening of WT and TG-17 hearts by echocardiography, *P = 0.00079. (D) WGA staining and quantification revealed increased size of cardiomyocytes following TAB. *P<0.05.
Similar articles
- A polymorphism in the porcine miR-208b is associated with microRNA biogenesis and expressions of SOX-6 and MYH7 with effects on muscle fibre characteristics and meat quality.
Kim JM, Lim KS, Hong JS, Kang JH, Lee YS, Hong KC. Kim JM, et al. Anim Genet. 2015 Feb;46(1):73-7. doi: 10.1111/age.12255. Epub 2014 Dec 22. Anim Genet. 2015. PMID: 25530254 - Evidence of MyomiR network regulation of beta-myosin heavy chain gene expression during skeletal muscle atrophy.
McCarthy JJ, Esser KA, Peterson CA, Dupont-Versteegden EE. McCarthy JJ, et al. Physiol Genomics. 2009 Nov 6;39(3):219-26. doi: 10.1152/physiolgenomics.00042.2009. Epub 2009 Aug 18. Physiol Genomics. 2009. PMID: 19690046 Free PMC article. - Cardiomyopathy in transgenic mice with cardiac-specific overexpression of serum response factor.
Zhang X, Azhar G, Chai J, Sheridan P, Nagano K, Brown T, Yang J, Khrapko K, Borras AM, Lawitts J, Misra RP, Wei JY. Zhang X, et al. Am J Physiol Heart Circ Physiol. 2001 Apr;280(4):H1782-92. doi: 10.1152/ajpheart.2001.280.4.H1782. Am J Physiol Heart Circ Physiol. 2001. PMID: 11247792 - Induction of S100b in myocardium: an intrinsic inhibitor of cardiac hypertrophy.
Parker TG, Marks A, Tsoporis JN. Parker TG, et al. Can J Appl Physiol. 1998 Aug;23(4):377-89. doi: 10.1139/h98-022. Can J Appl Physiol. 1998. PMID: 9677434 Review. - MicroRNAs 1, 133, and 206: critical factors of skeletal and cardiac muscle development, function, and disease.
Townley-Tilson WH, Callis TE, Wang D. Townley-Tilson WH, et al. Int J Biochem Cell Biol. 2010 Aug;42(8):1252-5. doi: 10.1016/j.biocel.2009.03.002. Epub 2009 Mar 14. Int J Biochem Cell Biol. 2010. PMID: 20619221 Free PMC article. Review.
Cited by
- Mesenchymal stem cells in cardiac regeneration: a detailed progress report of the last 6 years (2010-2015).
Singh A, Singh A, Sen D. Singh A, et al. Stem Cell Res Ther. 2016 Jun 4;7(1):82. doi: 10.1186/s13287-016-0341-0. Stem Cell Res Ther. 2016. PMID: 27259550 Free PMC article. Review. - First-Trimester Screening for Fetal Growth Restriction and Small-for-Gestational-Age Pregnancies without Preeclampsia Using Cardiovascular Disease-Associated MicroRNA Biomarkers.
Hromadnikova I, Kotlabova K, Krofta L. Hromadnikova I, et al. Biomedicines. 2022 Mar 19;10(3):718. doi: 10.3390/biomedicines10030718. Biomedicines. 2022. PMID: 35327520 Free PMC article. - Transcriptome Dynamics and Potential Roles of Sox6 in the Postnatal Heart.
An CI, Ichihashi Y, Peng J, Sinha NR, Hagiwara N. An CI, et al. PLoS One. 2016 Nov 10;11(11):e0166574. doi: 10.1371/journal.pone.0166574. eCollection 2016. PLoS One. 2016. PMID: 27832192 Free PMC article. - Circulating miR-499a and miR-125b as Potential Predictors of Left Ventricular Ejection Fraction Improvement after Cardiac Resynchronization Therapy.
Moscoso I, Cebro-Márquez M, Martínez-Gómez Á, Abou-Jokh C, Martínez-Monzonís MA, Martínez-Sande JL, González-Melchor L, García-Seara J, Fernández-López XA, Moraña-Fernández S, González-Juanatey JR, Rodríguez-Mañero M, Lage R. Moscoso I, et al. Cells. 2022 Jan 13;11(2):271. doi: 10.3390/cells11020271. Cells. 2022. PMID: 35053387 Free PMC article. - Role of MicroRNAs in Diagnosis, Prognosis, and Treatment of Acute Heart Failure: Ambassadors from Intracellular Zone.
Sadat-Ebrahimi SR, Aslanabadi N. Sadat-Ebrahimi SR, et al. Galen Med J. 2020 Jun 23;9:e1818. doi: 10.31661/gmj.v9i0.1818. eCollection 2020. Galen Med J. 2020. PMID: 34466598 Free PMC article. Review.
References
- Liew CC, Dzau VJ. Molecular genetics and genomics of heart failure. Nat Rev Genet. 2004;5:811–825. - PubMed
- Nabel EG. Cardiovascular disease. N Engl J Med. 2003;349:60–72. - PubMed
- Lowes BD, Gilbert EM, Abraham WT, Minobe WA, Larrabee P, et al. Myocardial gene expression in dilated cardiomyopathy treated with beta-blocking agents. N Engl J Med. 2002;346:1357–1365. - PubMed
- Kaab S, Barth AS, Margerie D, Dugas M, Gebauer M, et al. Global gene expression in human myocardium-oligonucleotide microarray analysis of regional diversity and transcriptional regulation in heart failure. J Mol Med. 2004;82:308–316. - PubMed
- Hwang JJ, Allen PD, Tseng GC, Lam CW, Fananapazir L, et al. Microarray gene expression profiles in dilated and hypertrophic cardiomyopathic end-stage heart failure. Physiol Genomics. 2002;10:31–44. - PubMed


