Mechanistic rationale for inhibition of poly(ADP-ribose) polymerase in ETS gene fusion-positive prostate cancer - PubMed (original) (raw)
Comment
. 2011 May 17;19(5):664-78.
doi: 10.1016/j.ccr.2011.04.010.
Bushra Ateeq, Yong Li, Anastasia K Yocum, Qi Cao, Irfan A Asangani, Sonam Patel, Xiaoju Wang, Hallie Liang, Jindan Yu, Nallasivam Palanisamy, Javed Siddiqui, Wei Yan, Xuhong Cao, Rohit Mehra, Aaron Sabolch, Venkatesha Basrur, Robert J Lonigro, Jun Yang, Scott A Tomlins, Christopher A Maher, Kojo S J Elenitoba-Johnson, Maha Hussain, Nora M Navone, Kenneth J Pienta, Sooryanarayana Varambally, Felix Y Feng, Arul M Chinnaiyan
Affiliations
- PMID: 21575865
- PMCID: PMC3113473
- DOI: 10.1016/j.ccr.2011.04.010
Comment
Mechanistic rationale for inhibition of poly(ADP-ribose) polymerase in ETS gene fusion-positive prostate cancer
J Chad Brenner et al. Cancer Cell. 2011.
Erratum in
- Cancer Cell. 2013 Apr 15;23(4):557
Abstract
Recurrent fusions of ETS genes are considered driving mutations in a diverse array of cancers, including Ewing's sarcoma, acute myeloid leukemia, and prostate cancer. We investigate the mechanisms by which ETS fusions mediate their effects, and find that the product of the predominant ETS gene fusion, TMPRSS2:ERG, interacts in a DNA-independent manner with the enzyme poly (ADP-ribose) polymerase 1 (PARP1) and the catalytic subunit of DNA protein kinase (DNA-PKcs). ETS gene-mediated transcription and cell invasion require PARP1 and DNA-PKcs expression and activity. Importantly, pharmacological inhibition of PARP1 inhibits ETS-positive, but not ETS-negative, prostate cancer xenograft growth. Finally, overexpression of the TMPRSS2:ERG fusion induces DNA damage, which is potentiated by PARP1 inhibition in a manner similar to that of BRCA1/2 deficiency.
Copyright © 2011 Elsevier Inc. All rights reserved.
Figures
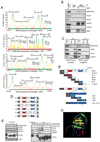
Figure 1. The TMPRSS-ERG gene fusion product interacts with PARP1 and the DNA-PK complex
(A) MS analysis of proteins interacting with ERG. Histograms show peptide coverage of ERG, DNA-PKcs, Ku70 and Ku80. (B) ERG, DNA-PKcs, PARP1 but not Ku70 or Ku80, interact independent of DNA. IP performed from VCaP cells which naturally harbor the ERG translocation. (C) ERG, DNA-PKcs, PARP1, Ku70 and Ku80 associate in ERG gene fusion positive human prostate cancer tissues. Representative ERG positive and negative prostate cancers shown of three pairs of tissues. (D) Schematic of TMPRSS2-ERG gene fusion tiling deletion expression vectors. (E) IP of DNA-PKcs, Ku70, Ku80 and PARP1 from HEK293 cells transfected with ERG expression vectors depicted in (D). Input Western is shown on the left, IP-Western shown on the right. All IPs were performed with FLAG antibody unless otherwise indicated. (F) Schematic representation of halo-tagged ERG fragment vectors. The construct were transcribed using wheat germ extracts and halo-tagged protein was purified. Proteins were then incubated with purified DNA-PKcs and IP-westerns performed. Fragments able to IP DNA-PKcs are indicated with a ‘+’. (G) ETS1:DNA crystal from (Garvie et al., 2001) used to demonstrate physical location of Tyrosine373 (from ERG) relative to the DNA binding residues. 1% of the total cell lysate used for IP was added to the input lane. Representative experiments are shown. See also Figure S1 and Table S1.
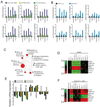
Figure 2. PARP1 and DNA-PKcs are required for ERG-regulated transcription
(A) ChIP of PARP1 and the DNAPK complex shows an association with ERG-regulated targets including the PLA1A promoter as well as FKBP5 PSA and TMPRSS2 enhancers, but not the negative control gene KIAA0066. ChIPs were performed in VCaP cells treated with control or one of two independent ERG siRNAs for 48 hours prior to cross-linking. (B) ChIP performed as in (A), but with stable RWPE-ERG or -LACZ cells. (C) Data from gene expression arrays was analyzed by molecular concept mapping. The gene set analyzed is the set of genes that were greater than 2-fold differential in all three siRNA treatments relative to control. This gene set was used to determine the correlation of genes regulated by ERG, DNA-PKcs and PARP1 in VCaP cells with published microarray data. Node size is proportional to the number of genes in the set and edges represent statistically significant associations (p < 0.01). Arrow directionality represents gene sets either being induced or repressed. (D) VCaP cells were treated with siRNA as indicated 48 hours prior to RNA isolation. qPCR was then run to confirm gene expression changes identified in the microarray experiment. Data is shown as a heat map with siRNA treatments along the x-axis and genes whose expression was analyzed by qPCR along the y-axis. Shades of green represent down-regulation of gene expression while shades of red represent up-regulation. (E) VCaP cells were treated with either NU7026 or Olaparib for 48 hours as indicated and qPCR analysis of ERG-target genes identified from gene expression microarray experiment was performed. (F) As in (D), except stable RWPE-ETV1 cells were used. All qPCR experiments were run three times in quadruplicate. All bar graphs are shown with +/− SEM unless otherwise indicated. See also Figure S2 and Table S2.
Figure 3. ERG-mediated invasion requires engagement of PARP1 and DNA-PKcs
(A) RWPE cells were infected with ERG adenovirus and treated with indicated siRNAs or different doses of the DNA-PKcs inhibitor, NU7026, or the small molecule PARP1 inhibitor, Olaparib, for 48 hours prior to plating cells in matrigel-coated Boyden chambers. After another 48 hours, cell invasion quantified. (B) As in (A), except VCaP cells. (C) As in (A), except stable RWPE cells transduced with ETV1 lentivirus. (D) As in (A), except PC3 or RWPE-SLC45A3-BRAF cells. Representative of three independent experiments. Representative photomicrographs of invaded cells shown (lower Boyden chamber stained with crystal violet). For all experiments mean +/− SEM shown, * p < 0.05, ** p < 0.01. See also Figure S3.
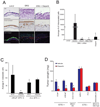
Figure 4. ERG-mediated invasion, intravasation and metastasis requires PARP1 activity in vivo
(A) CAM invasion assay performed using stable RWPE-LACZ, or RWPE-ERG cells labeled with microspheres (green fluorescence emission) and treated with or without a single dose of Olaparib [40mg/kg] as indicated. Seventy two hours after implantation, the upper CAM was harvested. Frozen sections were created and stained for hematoxylin and eosin (top row), human-specific cytokeratin (immunohistochemistry, middle row) or chicken-specific Type IV collagen (red immunofluorescence, bottom row). Arrows indicate cells invaded through the upper CAM. Representative images are shown. Scale bars are 200µM. (B) CAM intravasation assay performed using stable RWPE-ERG cells pre-treated with siRNA as indicated. Alternatively, RWPE-ERG cells were implanted and treated with a single dose of Olaparib immediately after implantation [40mg/kg]. Seventy two hours after implantation, the lower CAM was harvested. Total DNA was isolated from the lower CAM and qPCR was performed using human-specific ALU PCR primers. Total cell number was determined by comparing to a standard curve created using varying amounts of RWPE cells as input. (C) Liver metastasis in chicken embryos was assessed 8 days following implantation of either LNCaP (ETV1 rearrangement) or PC3 (no ETS rearrangement) cells onto the upper CAM. Animals were injected every other day with Olaparib [40mg/kg] prior to harvesting chicken livers. Total cell number was then quantified by qPCR as in (B). (D) ETS positive (VCaP and LNCaP), ETS negative (PC3 and 22RV1) prostate cancer cells as well as BRCA1 mutant (HCC1937) and BRCA1/2 WT (MDA-MB-231) breast cancer cells were implanted onto the upper CAM. These cell line xenografts were then treated with 40mg/kg Olaparib every other day for 8 days. Tumors (non-invaded cells remaining on the upper CAM) were collected and weighed. Average tumor weight is shown. For all experiments mean +/− SEM shown, * p < 0.05, ** p < 0.01. See also Figure S4.
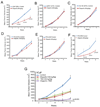
Figure 5. Inhibition of PARP1 alters ETS positive, but not ETS negative cell line xenograft growth
(A–F) Specificity screen for ETS positive and ETS negative tumor cell line xenografts. Cell lines were injected subcutaneously and grown until tumors were palpable. Xenografted mice then received I.P. injections of Olaparib 40mg/kg as indicated 5 days/week. Caliper measurements were taken weekly. ETS positive cell line xenografts were (A) VCaP (ERG rearrangement) and (F) PC3-ERG cells and the ETS negative xenografts are (B) 22RV1, (C) DU145 and (D, E) PC3-Control/-LACZ, respectively. (G) Mice xenografted with VCaP cells were treated as in as in (A) except with 100mg/kg Olaparib and/or 50 mg/kg Temozolomide (TMZ) as indicated. Olaparib was administered I.P. five days per week. TMZ was administered in two 5 day cycles with the first occurring during week 3 and the second occurring during week 5. For all experiments mean +/− SEM shown, p < 0.05, ** p < 0.01 unless indicated. See also Figure S5.
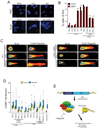
Figure 6. ETS transcription factors induce DNA damage which is potentiated by PARP inhibition
(A) γ-H2A.X immunofluorescence staining shows that ERG induces the formation of γ-H2A.X foci. Top row, benign prostate epithelial cells(PrEC) were infected with lentiviruses expressing LACZ or ERG. Bottom row, VCaP cells treated with control siRNA or ERG siRNA. (B) Quantification of γ-H2A.X and 53BP1 immunofluorescence staining in PrEC or VCaP cells. For all experiments mean +/− SEM shown, * p < 0.05, ** p < 0.01. (C) ETS overexpression or BRCA2 knockdown (with shRNA) induces DNA damage as assessed by neutral COMET assay in VCaP cells. Cells were treated with or without 10µM Olaparib for 48 hours. Cells with DNA damage have an extended “tail moment” of fragmented DNA shown in red. Relative tail length is shown in white. Representative images showing quantification of head and tail height, length and fluorescence intensity are shown (as indicated). (D) Quantification of average COMET tail moments following treatment as noted in the box plot. Statistical tests were performed using the two-way ANOVA test (described in S.O.M.) to determine if the increase in DNA damage in Olaparib-treated ETS overexpressing cells (PC3-ERG, PC3-ETV1 and VCaP) was statistically greater than the increase observed in Olaparib-treated control cells with low ETS expression (PrEC-LACZ, PC3-LACZ or VCaP treated with ERG siRNA) as indicated in the text. Similar statistical tests were used to compare the increase in BRCA2 shRNA expressing cells to PC3 cells transduced with control shRNA ** p < 0.01 (E) Proposed model to therapeutically target ETS gene fusions via their interacting enzyme, PARP1. All bar graphs are shown with +/− SEM unless otherwise indicated. See also Figure S6.
Comment on
- Beyond hormone therapy for prostate cancer with PARP inhibitors.
Sebastian de Bono J, Sandhu S, Attard G. Sebastian de Bono J, et al. Cancer Cell. 2011 May 17;19(5):573-4. doi: 10.1016/j.ccr.2011.05.003. Cancer Cell. 2011. PMID: 21575858 No abstract available.
Similar articles
- Targeted radiosensitization of ETS fusion-positive prostate cancer through PARP1 inhibition.
Han S, Brenner JC, Sabolch A, Jackson W, Speers C, Wilder-Romans K, Knudsen KE, Lawrence TS, Chinnaiyan AM, Feng FY. Han S, et al. Neoplasia. 2013 Oct;15(10):1207-17. doi: 10.1593/neo.131604. Neoplasia. 2013. PMID: 24204199 Free PMC article. - Rapamycin-resistant poly (ADP-ribose) polymerase-1 overexpression is a potential therapeutic target in lymphangioleiomyomatosis.
Sun Y, Gallacchi D, Zhang EY, Reynolds SB, Robinson L, Malinowska IA, Chiou TT, Pereira AM, Li C, Kwiatkowski DJ, Lee PS, Yu JJ. Sun Y, et al. Am J Respir Cell Mol Biol. 2014 Dec;51(6):738-49. doi: 10.1165/rcmb.2014-0033OC. Am J Respir Cell Mol Biol. 2014. PMID: 24874429 Free PMC article. - PARP-1 inhibition as a targeted strategy to treat Ewing's sarcoma.
Brenner JC, Feng FY, Han S, Patel S, Goyal SV, Bou-Maroun LM, Liu M, Lonigro R, Prensner JR, Tomlins SA, Chinnaiyan AM. Brenner JC, et al. Cancer Res. 2012 Apr 1;72(7):1608-13. doi: 10.1158/0008-5472.CAN-11-3648. Epub 2012 Jan 27. Cancer Res. 2012. PMID: 22287547 Free PMC article. - [PARP1 inhibitors: contemporary attempts at their use in anticancer therapy and future perspective].
Wiśnik E, Ryksa M, Koter-Michalak M. Wiśnik E, et al. Postepy Hig Med Dosw (Online). 2016 Apr 13;70:280-94. doi: 10.5604/17322693.1199303. Postepy Hig Med Dosw (Online). 2016. PMID: 27117104 Review. Polish. - [Molecular mechanisms of regulaion of transcription by PARP1].
Maliuchenko NV, Kulaeva OI, Kotova E, Chupyrkina AA, Nikitin DV, Kirpichnikov MP, Studitskiĭ VM. Maliuchenko NV, et al. Mol Biol (Mosk). 2015 Jan-Feb;49(1):99-113. Mol Biol (Mosk). 2015. PMID: 25916114 Review. Russian.
Cited by
- Poly(ADP-Ribose) Polymerase Inhibitors in Prostate Cancer: Molecular Mechanisms, and Preclinical and Clinical Data.
Sigorski D, Iżycka-Świeszewska E, Bodnar L. Sigorski D, et al. Target Oncol. 2020 Dec;15(6):709-722. doi: 10.1007/s11523-020-00756-4. Target Oncol. 2020. PMID: 33044685 Free PMC article. Review. - Emergence of ETS transcription factors as diagnostic tools and therapeutic targets in prostate cancer.
Rahim S, Uren A. Rahim S, et al. Am J Transl Res. 2013 Apr 19;5(3):254-68. Print 2013. Am J Transl Res. 2013. PMID: 23634237 Free PMC article. - The mutational landscape of prostate cancer.
Barbieri CE, Bangma CH, Bjartell A, Catto JW, Culig Z, Grönberg H, Luo J, Visakorpi T, Rubin MA. Barbieri CE, et al. Eur Urol. 2013 Oct;64(4):567-76. doi: 10.1016/j.eururo.2013.05.029. Epub 2013 May 18. Eur Urol. 2013. PMID: 23759327 Free PMC article. Review. - ERG induces epigenetic activation of Tudor domain-containing protein 1 (TDRD1) in ERG rearrangement-positive prostate cancer.
Kacprzyk LA, Laible M, Andrasiuk T, Brase JC, Börno ST, Fälth M, Kuner R, Lehrach H, Schweiger MR, Sültmann H. Kacprzyk LA, et al. PLoS One. 2013;8(3):e59976. doi: 10.1371/journal.pone.0059976. Epub 2013 Mar 29. PLoS One. 2013. PMID: 23555854 Free PMC article. - Immunohistochemical expression of ERG in the molecular epidemiology of fatal prostate cancer study.
Weinmann S, Van Den Eeden SK, Haque R, Chen C, Richert-Boe K, Schwartzman J, Gao L, Berry DL, Kallakury BV, Alumkal JJ. Weinmann S, et al. Prostate. 2013 Sep;73(13):1371-7. doi: 10.1002/pros.22684. Epub 2013 May 9. Prostate. 2013. PMID: 23661613 Free PMC article.
References
- Audeh MW, Carmichael J, Penson RT, Friedlander M, Powell B, Bell-McGuinn KM, Scott C, Weitzel JN, Oaknin A, Loman N, et al. Oral poly(ADP-ribose) polymerase inhibitor olaparib in patients with BRCA1 or BRCA2 mutations and recurrent ovarian cancer: a proof-of-concept trial. Lancet. 2010;376:245–251. - PubMed
- Barnes DE, Stamp G, Rosewell I, Denzel A, Lindahl T. Targeted disruption of the gene encoding DNA ligase IV leads to lethality in embryonic mice. Curr Biol. 1998;8:1395–1398. - PubMed
- Bennett EJ, Harper JW. DNA damage: ubiquitin marks the spot. Nature structural & molecular biology. 2008;15:20–22. - PubMed
- Bryant HE, Schultz N, Thomas HD, Parker KM, Flower D, Lopez E, Kyle S, Meuth M, Curtin NJ, Helleday T. Specific killing of BRCA2-deficient tumours with inhibitors of poly(ADP-ribose) polymerase. Nature. 2005;434:913–917. - PubMed
Publication types
MeSH terms
Substances
Grants and funding
- U01 CA111275-05S1/CA/NCI NIH HHS/United States
- R01 CA132874-03/CA/NCI NIH HHS/United States
- R00 CA129565/CA/NCI NIH HHS/United States
- R01 CA132874/CA/NCI NIH HHS/United States
- U01 CA111275-07/CA/NCI NIH HHS/United States
- P50CA69568/CA/NCI NIH HHS/United States
- UO1 CA113913/CA/NCI NIH HHS/United States
- R01 CA132874-04/CA/NCI NIH HHS/United States
- R01CA132874/CA/NCI NIH HHS/United States
- U01 CA113913/CA/NCI NIH HHS/United States
- R01 CA132874-02/CA/NCI NIH HHS/United States
- P50 CA069568-05/CA/NCI NIH HHS/United States
- K99 CA129565/CA/NCI NIH HHS/United States
- P50 CA069568/CA/NCI NIH HHS/United States
- U01 CA111275/CA/NCI NIH HHS/United States
- U01 CA111275-05/CA/NCI NIH HHS/United States
- U01 CA111275-06/CA/NCI NIH HHS/United States
- R00 CA129565-03/CA/NCI NIH HHS/United States
- R01 CA132874-01A1/CA/NCI NIH HHS/United States
- U01 CA111275-04/CA/NCI NIH HHS/United States
LinkOut - more resources
Full Text Sources
Other Literature Sources
Medical
Molecular Biology Databases
Miscellaneous
