Sequence-specific error profile of Illumina sequencers - PubMed (original) (raw)
doi: 10.1093/nar/gkr344. Epub 2011 May 16.
Taku Oshima, Takuya Morimoto, Shun Ikeda, Hirofumi Yoshikawa, Yuh Shiwa, Shu Ishikawa, Margaret C Linak, Aki Hirai, Hiroki Takahashi, Md Altaf-Ul-Amin, Naotake Ogasawara, Shigehiko Kanaya
Affiliations
- PMID: 21576222
- PMCID: PMC3141275
- DOI: 10.1093/nar/gkr344
Sequence-specific error profile of Illumina sequencers
Kensuke Nakamura et al. Nucleic Acids Res. 2011 Jul.
Abstract
We identified the sequence-specific starting positions of consecutive miscalls in the mapping of reads obtained from the Illumina Genome Analyser (GA). Detailed analysis of the miscall pattern indicated that the underlying mechanism involves sequence-specific interference of the base elongation process during sequencing. The two major sequence patterns that trigger this sequence-specific error (SSE) are: (i) inverted repeats and (ii) GGC sequences. We speculate that these sequences favor dephasing by inhibiting single-base elongation, by: (i) folding single-stranded DNA and (ii) altering enzyme preference. This phenomenon is a major cause of sequence coverage variability and of the unfavorable bias observed for population-targeted methods such as RNA-seq and ChIP-seq. Moreover, SSE is a potential cause of false single-nucleotide polymorphism (SNP) calls and also significantly hinders de novo assembly. This article highlights the importance of recognizing SSE and its underlying mechanisms in the hope of enhancing the potential usefulness of the Illumina sequencers.
Figures
Figure 1.
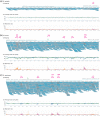
(i) First segment of the mapping results obtained from Illumina sequencing runs for (a) B. subtilis, (b) M. bovis and (c) B. pertussis, generated using MPSmap and PSmap allowing 35 mismatches per read. Pale blue lines associated with the gene ID and name indicate gene areas. Magenta arrows with SSE signs indicate the positions of visually identified SSE. Green arrows indicate the positions of SNPs. SSE positions automatically detected are accompanied by numbers, which indicate the reference positions. For (b) and (c), mappings with the first 10 million reads are displayed. (ii) The average base call quality for all aligned bases at each reference position. The blue plot indicates forward reads, and the green plot, reverse reads. (iii) Ratio of the number of mismatches between reference and reads to the number of all mapped bases at each reference position. The magenta plot indicates forward reads, and the orange plot, reverse reads.
Figure 2.
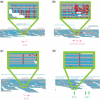
Examples of SSE and SNP positions in mapping of B. subtilis. Each drawing displays areas with (a) an SSE position, (b) two overlapping SSE positions with inverted repeat, (c) an SSE resembling an SNP and (d) true SNPs.
Figure 3.
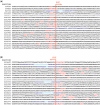
First 20 SSE positions of B. subtilis automatically detected in the (a) forward and (b) backward directions. The numbers in the left column indicate the genome coordinate of each SSE position. For each row, the base next to the vertical red line is the SSE position.
Figure 4.
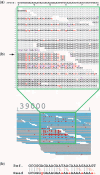
(a) Base-wise view of a part of the B. subtilis mapping result and (b) the alignment of the reference and the read in the middle row indicated by an arrow. The gray dotted lines show the match, whereas the pink dotted lines show the influence of previous base calls on mismatches.
Figure 5.
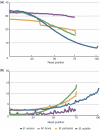
Plots of (a) average base call quality and (b) mismatch ratio along the sequencing cycle. Quality value of B. subtilis is based on the Illumina/Solexa standard protocol, while other data are PHREAD-type scores (30).
Figure 6.
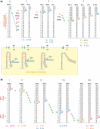
Schematic representation of the (a) inverted repeat and (b) enzyme preference for the SSE hypothetical mechanistic models. The gray numbers at the top indicate the cycle number and the numbers below indicate the relative population of each single-stranded DNA during the cycle. The colored bases and numbers below the drawings show the relative intensity of signals during that cycle. For instance, the second cycle of model (a) emits signals for C and G with an intensity of 73 and 27%, respectively.
Figure 7.
Comparison of coverage between (i) mapping allowing 35 mismatches, (ii) mapping allowing 2 mismatches and (iii) mapping of truncated reads using the first 35 bp, allowing 2 mismatches. Each drawing shows areas of the M. bovis genome including (a) an SSE position, (b) overlapping SSE positions in opposite directions associated with inverted repeats, and (c) multiple overlapping SSE positions. Mappings were carried out with MPSmap and PSmap for the first 10 million reads.
Similar articles
- Assembly of chloroplast genomes with long- and short-read data: a comparison of approaches using Eucalyptus pauciflora as a test case.
Wang W, Schalamun M, Morales-Suarez A, Kainer D, Schwessinger B, Lanfear R. Wang W, et al. BMC Genomics. 2018 Dec 29;19(1):977. doi: 10.1186/s12864-018-5348-8. BMC Genomics. 2018. PMID: 30594129 Free PMC article. - SMRT sequencing only de novo assembly of the sugar beet (Beta vulgaris) chloroplast genome.
Stadermann KB, Weisshaar B, Holtgräwe D. Stadermann KB, et al. BMC Bioinformatics. 2015 Sep 16;16(1):295. doi: 10.1186/s12859-015-0726-6. BMC Bioinformatics. 2015. PMID: 26377912 Free PMC article. - Illumina error correction near highly repetitive DNA regions improves de novo genome assembly.
Heydari M, Miclotte G, Van de Peer Y, Fostier J. Heydari M, et al. BMC Bioinformatics. 2019 Jun 3;20(1):298. doi: 10.1186/s12859-019-2906-2. BMC Bioinformatics. 2019. PMID: 31159722 Free PMC article. - Comparison of sequence reads obtained from three next-generation sequencing platforms.
Suzuki S, Ono N, Furusawa C, Ying BW, Yomo T. Suzuki S, et al. PLoS One. 2011;6(5):e19534. doi: 10.1371/journal.pone.0019534. Epub 2011 May 17. PLoS One. 2011. PMID: 21611185 Free PMC article. - [Sequencing project of Bacillus subtilis genome].
Ogasawara N. Ogasawara N. Tanpakushitsu Kakusan Koso. 1993 Feb;38(3):669-76. Tanpakushitsu Kakusan Koso. 1993. PMID: 8488303 Review. Japanese. No abstract available.
Cited by
- Applications of targeted gene capture and next-generation sequencing technologies in studies of human deafness and other genetic disabilities.
Lin X, Tang W, Ahmad S, Lu J, Colby CC, Zhu J, Yu Q. Lin X, et al. Hear Res. 2012 Jun;288(1-2):67-76. doi: 10.1016/j.heares.2012.01.004. Epub 2012 Jan 14. Hear Res. 2012. PMID: 22269275 Free PMC article. Review. - Next Generation Sequencing of Actinobacteria for the Discovery of Novel Natural Products.
Gomez-Escribano JP, Alt S, Bibb MJ. Gomez-Escribano JP, et al. Mar Drugs. 2016 Apr 13;14(4):78. doi: 10.3390/md14040078. Mar Drugs. 2016. PMID: 27089350 Free PMC article. Review. - Advantages of Array-Based Technologies for Pre-Emptive Pharmacogenomics Testing.
Shahandeh A, Johnstone DM, Atkins JR, Sontag JM, Heidari M, Daneshi N, Freeman-Acquah E, Milward EA. Shahandeh A, et al. Microarrays (Basel). 2016 May 28;5(2):12. doi: 10.3390/microarrays5020012. Microarrays (Basel). 2016. PMID: 27600079 Free PMC article. Review. - A comprehensive metatranscriptome analysis pipeline and its validation using human small intestine microbiota datasets.
Leimena MM, Ramiro-Garcia J, Davids M, van den Bogert B, Smidt H, Smid EJ, Boekhorst J, Zoetendal EG, Schaap PJ, Kleerebezem M. Leimena MM, et al. BMC Genomics. 2013 Aug 2;14:530. doi: 10.1186/1471-2164-14-530. BMC Genomics. 2013. PMID: 23915218 Free PMC article. - Canonical A-to-I and C-to-U RNA editing is enriched at 3'UTRs and microRNA target sites in multiple mouse tissues.
Gu T, Buaas FW, Simons AK, Ackert-Bicknell CL, Braun RE, Hibbs MA. Gu T, et al. PLoS One. 2012;7(3):e33720. doi: 10.1371/journal.pone.0033720. Epub 2012 Mar 20. PLoS One. 2012. PMID: 22448268 Free PMC article.
References
- Fujimoto A, Nakagawa H, Hosono N, Nakano K, Abe T, Boroevich KA, Nagasaki M, Yamaguchi R, Shibuya T, Kubo M, et al. Whole-genome sequencing and comprehensive variant analysis of a Japanese individual using massively parallel sequencing. Nat. Genet. 2010;42:931–936. - PubMed
- Bennett S. Solexa Ltd. Pharmacogenomics. 2004;5:433–438. - PubMed
Publication types
MeSH terms
LinkOut - more resources
Full Text Sources
Other Literature Sources
