The Dbp5 cycle at the nuclear pore complex during mRNA export I: dbp5 mutants with defects in RNA binding and ATP hydrolysis define key steps for Nup159 and Gle1 - PubMed (original) (raw)
The Dbp5 cycle at the nuclear pore complex during mRNA export I: dbp5 mutants with defects in RNA binding and ATP hydrolysis define key steps for Nup159 and Gle1
Christine A Hodge et al. Genes Dev. 2011.
Abstract
Nuclear export of messenger RNA (mRNA) occurs by translocation of mRNA/protein complexes (mRNPs) through nuclear pore complexes (NPCs). The DEAD-box protein Dbp5 mediates export by triggering removal of mRNP proteins in a spatially controlled manner. This requires Dbp5 interaction with Nup159 in NPC cytoplasmic filaments and activation of Dbp5's ATPase activity by Gle1 bound to inositol hexakisphosphate (IP(6)). However, the precise sequence of events within this mechanism has not been fully defined. Here we analyze dbp5 mutants that alter ATP binding, ATP hydrolysis, or RNA binding. We found that ATP binding and hydrolysis are required for efficient Dbp5 association with NPCs. Interestingly, mutants defective for RNA binding are dominant-negative (DN) for mRNA export in yeast and human cells. We show that the DN phenotype stems from competition with wild-type Dbp5 for Gle1 at NPCs. The Dbp5-Gle1 interaction is limiting for export and, importantly, can be independent of Nup159. Fluorescence recovery after photobleaching experiments in yeast show a very dynamic association between Dbp5 and NPCs, averaging <1 sec, similar to reported NPC translocation rates for mRNPs. This work reveals critical steps in the Gle1-IP(6)/Dbp5/Nup159 cycle, and suggests that the number of remodeling events mediated by a single Dbp5 is limited.
Figures
Figure 1.
Effect of overexpressed wild-type and altered Dbp5 proteins on growth and mRNA export. (A) Organization of Dbp5, location of conserved DBP motifs, and location of mutations shown. (B) Effect of inducing expression of high levels of wild-type or altered Dbp5 proteins on yeast cell growth. Serial dilutions of wild-type yeast cells containing GAL1 plasmids encoding wild-type or altered Dbp5 were plated on plates containing dex or gal and incubated for 5 d at 30°C. (C) Coding regions for wild-type and altered Dbp5 were placed under control of the GAL1 promoter. Expression of wild-type or altered proteins was induced by transfer of cells from 2% raf to 2% gal and poly(A)+ RNA distribution detected by fluorescent in situ hybridization (FISH). (D) Western blot for wild-type and altered Dbp5 proteins. Cells were grown overnight in raf and then incubated in medium containing either 2% dex or 2% gal for indicated times. All cells express Dbp5-GFP from the genomic DBP5 locus, with its position also shown.
Figure 2.
(A) Localization of GFP fusions to wild-type and altered Dbp5 proteins. Cells expressing GFP-tagged proteins from centromeric plasmids were visualized by fluorescence microscopy. Although the R369G mutant inhibits growth, cells grow, albeit slowly, when R369G is expressed from a centromeric plasmid. (B) Effect of depleting wild-type Dbp5 on localization of wild-type and variant Dbp5s. Cells expressing wild-type Dbp5 only from the GAL1 promoter were grown overnight (18 h) in medium containing gal (2%) or dex (2%). Expression was induced by transfer of cells from medium containing 2% raf to medium containing 2% gal and was imaged after 4 h. (C) Induction of wild-type Dbp5 reduces growth inhibition caused by R369G. Wild-type Dbp5 was expressed from a GAL1 promoter. Serial dilutions of cells were plated on either dex- or gal-containing plates for 3 d.
Figure 3.
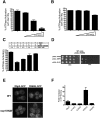
Biochemical analyses of Dbp5 and dbp5 variants. (A) Initial velocities of ATP hydrolysis were assayed and reported as a percentage of wild-type Dbp5 activity from the average of three replicates. All assays are in the presence of 1 μM RNA with 250 nM the respective Dbp5. (B) ATP binding was measured by in vitro UV cross-linking and reported as a percentage of ATP binding by wild-type Dbp5 in the presence and absence of 1 μM RNA. (C) Stimulation of Dbp5 or R369G ATPase activity by RNA was measured with increasing concentrations of oligo(A)25 RNA, all with 500 nM respective Dbp5, 250 nM Gle1, and 100 nM IP6. (D) Summary of in vitro biochemical properties of wild-type (WT) and variant Dbp5 proteins. Assays were conducted with purified recombinant proteins for RNA by filter binding (binding affinity percent relative to wild-type), ATP binding with RNA (B), fold increased ATP binding with Gle1-IP6 (Fig. 5F), ATPase activity with RNA and Gle1-IP6 (A), and Nup159 binding by soluble binding assays; plus sign (+) indicates normal binding.
Figure 4.
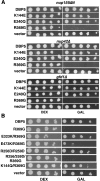
(A) Comparing the effects of expressing wild-type or mutant DBP5 on growth of yeast cells carrying mutations affecting Nup159, Nup42, or Gfd1. Cells were plated on dex- or gal-containing plates. All mutant strains express wild-type Dbp5 from the genomic DBP5 locus. (B) Effect of combining mutations affecting Dbp5's interactions with ATP, Nup159, or Gle1 on the DN growth inhibitory phenotype of R369G.
Figure 5.
In vitro ATPase and ATP-binding assays measuring the DN effect of R369G on wild-type Dbp5. (A) ATPase assays were conducted with 500 nM Dbp5, 250 nM Gle1, 100 nM IP6, and increasing amounts of R369G (50 nM, 250 nM, and 1.25 μM). (B) ATPase assays were conducted as in A but with K144Q protein. (C) “Rescue” assays were conducted as in A with R369G protein (250 nM) and increasing amounts of Gle1-IP6 complex at 1.4-fold, twofold, and threefold excess of that used in A. The percent ATPase activation by Gle1-IP6 was calculated by subtracting measured initial velocities (Vi) for ATP hydrolysis in the presence of R369G or K144Q minus Vi for Dbp5 with Gle1-IP6. (D) Effect of high-level expression of Dbp5 or Gle1 on growth of wild-type (WT) cells expressing R369G. Serial dilutions of cells carrying plasmids with DBP5 or GLE1 under control of the GAL1 promoter were plated on plates containing dex (left) or gal (right). (E) Wild-type (WT) or nup159ΔN cells expressing Dbp5-GFP or R369G-GFP were grown overnight and analyzed by fluorescence microscopy. (F) Fold activation of ATP binding by Dbp5 in the presence of Gle1-IP6 (1 μM/400 nM) was determined using in vitro UV cross-linking assays as above (Fig. 3B).
Figure 6.
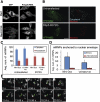
Association of Dbp5 with NPCs is ATP-dependent and dynamic. (A) Wild-type cells expressing Dbp5-GFP or R369G-GFP were visualized by fluorescence microscopy before and 10 min after addition of sodium azide (10 mM) and 2-deoxy glucose (10 mM). (B) FRAP analysis was performed on wild-type cells expressing Dbp5-GFP or Nup82-GFP from their genomic loci. (C) GFP-tagged proteins (wild-type and R369G) were expressed from centromeric plasmids in wild-type cells under control of the DBP5 promoter. FRAP was performed on the brightest cells. The arrows in B and C indicate the lowest levels to which the signal dropped immediately after photobleaching. The green line in each panel is the bleached sample, and the red line is a control region of the same cell that was not subjected to photobleaching. Each panel in B and C represents a single FRAP analysis. In each case, >30 separate FRAP analyses were performed, with little difference among them and one representative shown.
Figure 7.
The effect of hDbp5 R372G on mRNA export. (A) FISH was performed to localize poly(A)+ RNA in cells expressing only wild-type Dbp5 or wild-type Dbp5 and R372G. Bar, 25 μm. (B) Cells expressing ½-Mini-Dys+intron-MS2 mRNA (Mor et al. 2010) were induced to transcribe, and mRNPs were visualized by using YFP-MS2 protein that binds to the 3′ UTR of these mRNAs (green). (Left) Untransfected cell showing mRNPs in the cytoplasm and nucleoplasm (top), compared with a hDbp5 R372G-epxpressing cell containing nuclear-confined mRNPs only (bottom). (Right) Analyzed images depicting cytoplasmic mRNPs are shown in cyan, and nuclear RNPs are shown in red. Bar, 10 μm. (C) The number of cytoplasmic versus nucleoplasmic YFP-MS2-tagged mRNPs in two cell lines was counted. Bars show standard deviation, N = 709 (mini-Dys-MS2 mRNPs) and 1045 (½-Mini-Dys+intron-MS2 mRNPs). (D) The number of NE-anchored mRNPs was measured in untransfected and Dbp5 R372G-expressing cells. Bars show standard deviation, N = 80 (Mini-Dys-MS2 mRNPs) and 64 (½-Mini-Dys+intron-MS2 mRNPs). (E) Frames from a movie showing mRNP movement in a Dbp5 R372G-expressing cell in which the mRNP becomes transiently anchored at the NE. Track of mRNP movement is shown in green, and the position of the NE is shown in red. Bar, 1 μm.
Comment in
- Regulation of the Dbp5 ATPase cycle in mRNP remodeling at the nuclear pore: a lively new paradigm for DEAD-box proteins.
Ledoux S, Guthrie C. Ledoux S, et al. Genes Dev. 2011 Jun 1;25(11):1109-14. doi: 10.1101/gad.2062611. Genes Dev. 2011. PMID: 21632821 Free PMC article.
Similar articles
- The Dbp5 cycle at the nuclear pore complex during mRNA export II: nucleotide cycling and mRNP remodeling by Dbp5 are controlled by Nup159 and Gle1.
Noble KN, Tran EJ, Alcázar-Román AR, Hodge CA, Cole CN, Wente SR. Noble KN, et al. Genes Dev. 2011 May 15;25(10):1065-77. doi: 10.1101/gad.2040611. Genes Dev. 2011. PMID: 21576266 Free PMC article. - Inositol hexakisphosphate and Gle1 activate the DEAD-box protein Dbp5 for nuclear mRNA export.
Alcázar-Román AR, Tran EJ, Guo S, Wente SR. Alcázar-Román AR, et al. Nat Cell Biol. 2006 Jul;8(7):711-6. doi: 10.1038/ncb1427. Epub 2006 Jun 18. Nat Cell Biol. 2006. PMID: 16783363 - A conserved mechanism of DEAD-box ATPase activation by nucleoporins and InsP6 in mRNA export.
Montpetit B, Thomsen ND, Helmke KJ, Seeliger MA, Berger JM, Weis K. Montpetit B, et al. Nature. 2011 Apr 14;472(7342):238-42. doi: 10.1038/nature09862. Epub 2011 Mar 27. Nature. 2011. PMID: 21441902 Free PMC article. - Dbp5, Gle1-IP6 and Nup159: a working model for mRNP export.
Folkmann AW, Noble KN, Cole CN, Wente SR. Folkmann AW, et al. Nucleus. 2011 Nov-Dec;2(6):540-8. doi: 10.4161/nucl.2.6.17881. Epub 2011 Nov 1. Nucleus. 2011. PMID: 22064466 Free PMC article. Review. - Dbp5 - from nuclear export to translation.
Tieg B, Krebber H. Tieg B, et al. Biochim Biophys Acta. 2013 Aug;1829(8):791-8. doi: 10.1016/j.bbagrm.2012.10.010. Epub 2012 Nov 2. Biochim Biophys Acta. 2013. PMID: 23128325 Review.
Cited by
- Nuclear trafficking in health and disease.
Mor A, White MA, Fontoura BM. Mor A, et al. Curr Opin Cell Biol. 2014 Jun;28:28-35. doi: 10.1016/j.ceb.2014.01.007. Epub 2014 Feb 11. Curr Opin Cell Biol. 2014. PMID: 24530809 Free PMC article. Review. - Regulation of mRNA trafficking by nuclear pore complexes.
Bonnet A, Palancade B. Bonnet A, et al. Genes (Basel). 2014 Sep 2;5(3):767-91. doi: 10.3390/genes5030767. Genes (Basel). 2014. PMID: 25184662 Free PMC article. Review. - Regulation of the Dbp5 ATPase cycle in mRNP remodeling at the nuclear pore: a lively new paradigm for DEAD-box proteins.
Ledoux S, Guthrie C. Ledoux S, et al. Genes Dev. 2011 Jun 1;25(11):1109-14. doi: 10.1101/gad.2062611. Genes Dev. 2011. PMID: 21632821 Free PMC article. - Gle1 is a multifunctional DEAD-box protein regulator that modulates Ded1 in translation initiation.
Bolger TA, Wente SR. Bolger TA, et al. J Biol Chem. 2011 Nov 18;286(46):39750-9. doi: 10.1074/jbc.M111.299321. Epub 2011 Sep 23. J Biol Chem. 2011. PMID: 21949122 Free PMC article. - Nucleoporin FG domains facilitate mRNP remodeling at the cytoplasmic face of the nuclear pore complex.
Adams RL, Terry LJ, Wente SR. Adams RL, et al. Genetics. 2014 Aug;197(4):1213-24. doi: 10.1534/genetics.114.164012. Epub 2014 Jun 14. Genetics. 2014. PMID: 24931410 Free PMC article.
References
- Alcazar-Roman AR, Tran EJ, Guo S, Wente SR 2006. Inositol hexakisphosphate and Gle1 activate the DEAD-box protein Dbp5 for nuclear mRNA export. Nat Cell Biol 8: 711–716 - PubMed
Publication types
MeSH terms
Substances
Grants and funding
- T32 CA119925/CA/NCI NIH HHS/United States
- GM33998/GM/NIGMS NIH HHS/United States
- F31 HD061181/HD/NICHD NIH HHS/United States
- T32 AR007576/AR/NIAMS NIH HHS/United States
- 1F31 NS070431/NS/NINDS NIH HHS/United States
- F32 GM075459/GM/NIGMS NIH HHS/United States
- R37 GM051219/GM/NIGMS NIH HHS/United States
- R01 GM033998/GM/NIGMS NIH HHS/United States
- 1F32 GM075459/GM/NIGMS NIH HHS/United States
- R37 GM51219/GM/NIGMS NIH HHS/United States
- F31 NS070431/NS/NINDS NIH HHS/United States
- 5T32 CA119925/CA/NCI NIH HHS/United States
- AR07576/AR/NIAMS NIH HHS/United States
- 1F31 HD061181/HD/NICHD NIH HHS/United States
- 260441/ERC_/European Research Council/International
LinkOut - more resources
Full Text Sources
Molecular Biology Databases


