Deep and highly sensitive proteome coverage by LC-MS/MS without prefractionation - PubMed (original) (raw)
Deep and highly sensitive proteome coverage by LC-MS/MS without prefractionation
Suman S Thakur et al. Mol Cell Proteomics. 2011 Aug.
Abstract
In-depth MS-based proteomics has necessitated fractionation of either proteins or peptides or both, often requiring considerable analysis time. Here we employ long liquid chromatography runs with high resolution coupled to an instrument with fast sequencing speed to investigate how much of the proteome is directly accessible to liquid chromatography-tandem MS characterization without any prefractionation steps. Triplicate single-run analyses identified 2990 yeast proteins, 68% of the total measured in a comprehensive yeast proteome. Among them, we covered the enzymes of the glycolysis and gluconeogenesis pathway targeted in a recent multiple reaction monitoring study. In a mammalian cell line, we identified 5376 proteins in a triplicate run, including representatives of 173 out of 200 KEGG metabolic and signaling pathways. Remarkably, the majority of proteins could be detected in the samples at sub-femtomole amounts and many in the low attomole range, in agreement with absolute abundance estimation done in previous works (Picotti et al. Cell, 138, 795-806, 2009). Our results imply an unexpectedly large dynamic range of the MS signal and sensitivity for liquid chromatography-tandem MS alone. With further development, single-run analysis has the potential to radically simplify many proteomic studies while maintaining a systems-wide view of the proteome.
Figures
Fig. 1.
Chromatographic performance at long gradient times. A, Yeast peptides separated using a 480 min gradient on a 50 cm column packed with 1.8 μm C18 beads. Contour plot from MaxQuant shows uniform peptide separation along the retention time and the m/z range. B, Same as (A), but using a 140 min gradient. C, Comparison of the number of peptides, number of isotope patterns and peak widths in two different gradient lengths. D, Comparison of the distribution of peak widths between the two gradients.
Fig. 2.
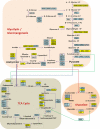
Single-run analysis of the yeast proteome by LC MS/MS. Schematic representation of proteins involved in glycolysis/gluconeogenesis, in the citric acid cycle (TCA cycle) and in the glyoxylate pathway in yeast. The scheme is based on ref (20) and extra proteins were added based on the KEGG pathway database. Proteins that were identified in the single-run analysis and were not targeted in ref (20) are in yellow and proteins that were found by both strategies are in blue. Gal10 was not targeted and not found in the single-run analysis (white).
Fig. 3.
Dynamic range of single-run analysis of a human cell line. Ranking of HEK293 proteins according to their absolute amounts. Quantification is based on added peptide intensities of the proteins as described in the EXPERIMENTAL PROCEDURES section.
Fig. 4.
KEGG pathways in HEK293 cells. Analysis of the representation of KEGG pathways in a triplicate of single-run analyses compared with the total number of proteins in the pathway according to the KEGG database.
Fig. 5.
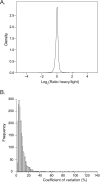
SILAC-based quantification of HEK293 proteins. HEK293 cells were labeled with heavy or light amino acids and quantified using single-run analysis. A, A density plot shows the ratio distribution of proteins from a triplicate single-run analysis. B, Histogram of the coefficient of variation of each of the quantified proteins.
Similar articles
- System-wide perturbation analysis with nearly complete coverage of the yeast proteome by single-shot ultra HPLC runs on a bench top Orbitrap.
Nagaraj N, Kulak NA, Cox J, Neuhauser N, Mayr K, Hoerning O, Vorm O, Mann M. Nagaraj N, et al. Mol Cell Proteomics. 2012 Mar;11(3):M111.013722. doi: 10.1074/mcp.M111.013722. Epub 2011 Oct 20. Mol Cell Proteomics. 2012. PMID: 22021278 Free PMC article. - Prefractionation of proteome by liquid isoelectric focusing prior to two-dimensional liquid chromatography mass spectrometric identification.
Li RX, Zhou H, Li SJ, Sheng QH, Xia QC, Zeng R. Li RX, et al. J Proteome Res. 2005 Jul-Aug;4(4):1256-64. doi: 10.1021/pr049751g. J Proteome Res. 2005. PMID: 16083275 - [Recent progress in capillary electrophoresis-based high-sensitivity proteomics].
Yang Y, Tian R. Yang Y, et al. Se Pu. 2020 Oct 8;38(10):1125-1132. doi: 10.3724/SP.J.1123.2020.03003. Se Pu. 2020. PMID: 34213109 Review. Chinese. - The clinical impact of recent advances in LC-MS for cancer biomarker discovery and verification.
Wang H, Shi T, Qian WJ, Liu T, Kagan J, Srivastava S, Smith RD, Rodland KD, Camp DG 2nd. Wang H, et al. Expert Rev Proteomics. 2016;13(1):99-114. doi: 10.1586/14789450.2016.1122529. Epub 2015 Dec 19. Expert Rev Proteomics. 2016. PMID: 26581546 Free PMC article. Review.
Cited by
- High-throughput proteomics of nanogram-scale samples with Zeno SWATH MS.
Wang Z, Mülleder M, Batruch I, Chelur A, Textoris-Taube K, Schwecke T, Hartl J, Causon J, Castro-Perez J, Demichev V, Tate S, Ralser M. Wang Z, et al. Elife. 2022 Nov 30;11:e83947. doi: 10.7554/eLife.83947. Elife. 2022. PMID: 36449390 Free PMC article. - Comparison of the LTQ-Orbitrap Velos and the Q-Exactive for proteomic analysis of 1-1000 ng RAW 264.7 cell lysate digests.
Sun L, Zhu G, Dovichi NJ. Sun L, et al. Rapid Commun Mass Spectrom. 2013 Jan 15;27(1):157-62. doi: 10.1002/rcm.6437. Rapid Commun Mass Spectrom. 2013. PMID: 23239329 Free PMC article. - A fast workflow for identification and quantification of proteomes.
Ding C, Jiang J, Wei J, Liu W, Zhang W, Liu M, Fu T, Lu T, Song L, Ying W, Chang C, Zhang Y, Ma J, Wei L, Malovannaya A, Jia L, Zhen B, Wang Y, He F, Qian X, Qin J. Ding C, et al. Mol Cell Proteomics. 2013 Aug;12(8):2370-80. doi: 10.1074/mcp.O112.025023. Epub 2013 May 13. Mol Cell Proteomics. 2013. PMID: 23669031 Free PMC article. - Automated selected reaction monitoring software for accurate label-free protein quantification.
Teleman J, Karlsson C, Waldemarson S, Hansson K, James P, Malmström J, Levander F. Teleman J, et al. J Proteome Res. 2012 Jul 6;11(7):3766-73. doi: 10.1021/pr300256x. Epub 2012 Jun 14. J Proteome Res. 2012. PMID: 22658081 Free PMC article. - A Double-Barrel Liquid Chromatography-Tandem Mass Spectrometry (LC-MS/MS) System to Quantify 96 Interactomes per Day.
Hosp F, Scheltema RA, Eberl HC, Kulak NA, Keilhauer EC, Mayr K, Mann M. Hosp F, et al. Mol Cell Proteomics. 2015 Jul;14(7):2030-41. doi: 10.1074/mcp.O115.049460. Epub 2015 Apr 17. Mol Cell Proteomics. 2015. PMID: 25887394 Free PMC article.
References
- Aebersold R., Mann M. (2003) Mass spectrometry-based proteomics. Nature 422, 198–207 - PubMed
- Yates J. R., 3rd, Gilchrist A., Howell K. E., Bergeron J. J. (2005) Proteomics of organelles and large cellular structures. Nat. Rev. Mol. Cell Biol. 6, 702–714 - PubMed
- Cravatt B. F., Simon G. M., Yates J. R., 3rd (2007) The biological impact of mass-spectrometry-based proteomics. Nature 450, 991–1000 - PubMed
- Bantscheff M., Eberhard D., Abraham Y., Bastuck S., Boesche M., Hobson S., Mathieson T., Perrin J., Raida M., Rau C., Reader V., Sweetman G., Bauer A., Bouwmeester T., Hopf C., Kruse U., Neubauer G., Ramsden N., Rick J., Kuster B., Drewes G. (2007) Quantitative chemical proteomics reveals mechanisms of action of clinical ABL kinase inhibitors. Nat Biotechnol 25, 1035–1044 - PubMed
- Choudhary C., Mann M. (2010) Decoding signalling networks by mass spectrometry-based proteomics. Nat. Rev. Mol. Cell Biol. 11, 427–439 - PubMed
Publication types
MeSH terms
Substances
LinkOut - more resources
Full Text Sources
Other Literature Sources
Molecular Biology Databases


