The eisosome core is composed of BAR domain proteins - PubMed (original) (raw)
The eisosome core is composed of BAR domain proteins
Agustina Olivera-Couto et al. Mol Biol Cell. 2011.
Abstract
Eisosomes define sites of plasma membrane organization. In Saccharomyces cerevisiae, eisosomes delimit furrow-like plasma membrane invaginations that concentrate sterols, transporters, and signaling molecules. Eisosomes are static macromolecular assemblies composed of cytoplasmic proteins, most of which have no known function. In this study, we used a bioinformatics approach to analyze a set of 20 eisosome proteins. We found that the core components of eisosomes, paralogue proteins Pil1 and Lsp1, are distant homologues of membrane-sculpting Bin/amphiphysin/Rvs (BAR) proteins. Consistent with this finding, purified recombinant Pil1 and Lsp1 tubulated liposomes and formed tubules when the proteins were overexpressed in mammalian cells. Structural homology modeling and site-directed mutagenesis indicate that Pil1 positively charged surface patches are needed for membrane binding and liposome tubulation. Pil1 BAR domain mutants were defective in both eisosome assembly and plasma membrane domain organization. In addition, we found that eisosome-associated proteins Slm1 and Slm2 have F-BAR domains and that these domains are needed for targeting to furrow-like plasma membrane invaginations. Our results support a model in which BAR domain protein-mediated membrane bending leads to clustering of lipids and proteins within the plasma membrane.
Figures
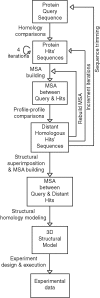
FIGURE 1:
Bioinformatics pipeline. Protein sequence queries were subjected to homology comparisons using PSI-BLAST. Resulting hits were used to build MSAs, and then profile–profile comparisons were executed using both hidden Markov models–based algorithms (HHsearch) and COMPASS. Structure-based MSAs were then built using STAMP and T-Coffee and subsequently used for structure modeling. See Materials and Methods for details.
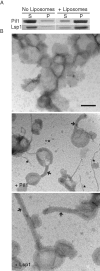
FIGURE 2:
Pil1 and Lsp1 bind and tubulate liposomes in vitro. (A) Purified recombinant Pil1 and Lsp1 were incubated with or without bovine brain total lipid extract/PI(4,5)P2 liposomes, ultracentrifuged, and supernatant (S) vs. pellet (P) fractions were separated by SDS–PAGE and stained with Coomassie. (B) Representative electron micrographs of liposomes incubated with either Pil1 or Lsp1. Scale bar, 200 nm. Arrows and asterisks indicate liposome tubules and protein filaments, respectively.
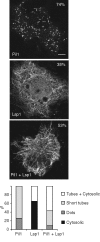
FIGURE 3:
Pil1 and Lsp1 form tubular structures in vivo. Confocal immunofluorescence micrographs of COS-7 cells overexpressing untagged Pil1, Lsp1, or both proteins. Percentages indicate the proportion of positively transfected cells that exhibited the described pattern. Scale bar, 6 μm. Bottom, quantitative analysis of the different distribution patterns of the proteins observed microscopically. More than 75 cells from three independent experiments were analyzed for each condition tested.
FIGURE 4:
Structural modeling and functional analysis of Pil1 BAR domain. (A) Cartoon representation and homology model of a Pil1 monomer based on the crystal structures of five distant homologues. The chain is color coded from blue to red from N-terminus to C-terminus, respectively. Alpha helices are labeled. (B) Dimeric arrangement of Pil1. The modeled monomer was sequentially superimposed onto chains A and B of the Drosophila amphiphysin dimer (1URU). Cartoon representation (left) is rotated axially 90º, showing the electrostatic surface of the concave side of the dimer (right). Conserved basic residues that were targeted for mutagenesis studies are indicated. (C) Purified recombinant wild-type, mut2, and mut3 versions of Pil1 were tested for binding to liposomes. Quantification of two independent experiments is in the graph below; error bars correspond to standard deviations. (D) Confocal immunofluorescence micrographs of COS-7 cells overexpressing wild-type or mut3 Pil1. Percentages indicate the proportion of cells that exhibited the pattern shown. Scale bar, 6 μm.
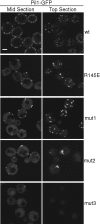
FIGURE 5:
Pil1 BAR domain positively charged residues are necessary for eisosome assembly and organization. The C-terminally GFP-tagged versions of wild-type (wt), mut1, mut2, or mut3 Pil1 were expressed under control of the endogenous promoter in _pil1_Δ yeast cells. Representative confocal micrographs of mid and top sections are shown. Scale bar, 2 μm.
FIGURE 6:
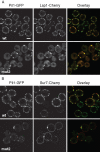
MCC organization is disrupted in Pil1 BAR domain mutants. Representative confocal midsection micrographs of Lsp1-Cherry (A) and Sur7-Cherry (B) cells expressing wild-type (wt) and BAR domain mutant variants of Pil1-GFP. Scale bar, 2 μm.
FIGURE 7:
Mut2 Pil1 is defective in plasma membrane association and forms abnormally large assemblies. _pil1_Δ yeast cells expressing C-terminally GFP-tagged wild-type (wt) or mut2 Pil1 were grown in SC media at 30ºC to mid-log phase and then imaged using the same microscope settings. Fluorescence measurements where made for a total of 150 yeast mother cells with small and medium-sized buds as part of three independent experiments. (A) Representative mid section confocal micrographs. Scale bar, 2 μm. (B) Western blot analysis of Pil1-GFP mutants. G6PDH is shown as a loading control. (C) Density distribution of Pil1-GFP foci number in mid confocal sections. (D) Density distribution of fluorescence intensities of GFP foci. (E) Cytoplasmic and plasma membrane–associated GFP fluorescence ratios. Error bars correspond to standard deviations. *p < 0.05.
FIGURE 8:
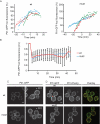
Mut2 Pil1 is defective in nucleation site formation. Yeast strains were grown in SC at 30ºC to mid-log phase and then imaged by confocal 3D time-lapse microscopy under the same growth conditions. (A) Mut2 assembly rate is normal but prolonged. Measurement of fluorescence intensity of individual Pil1 foci in growing buds. Three representative examples are shown for each strain. Each data set was fit to a bilinear behavior using the Davies test. The point where a change in the slope was detected was defined as time 0 and 100% of relative fluorescence units. Negative slopes observed for wild-type Pil1-GFP fluorescence at late time points are likely due to inefficient bleaching correction (see Materials and Methods for details). (B) Mut2 eisosomes are as stable as wild type. Pil1 foci were bleached (time = 0), and fluorescence recovery was monitored over time. Fluorescence measurements were made for a total of 25 bleached foci as part of three independent experiments. Error bars indicate standard deviations. (C, D) Wild-type Pil1 complements mut2. Representative confocal micrographs of mid sections of yeast cells expressing fluorescently tagged versions of Pil1 are shown. (C) GFP-tagged wild-type and mut2 Pil1 cells with (right) and without (left) the wild-type PIL1 gene under control of its own promoter. (D) GFP-tagged wild-type and mut2 Pil1 cells with an extra copy of wild-type PIL1-mCherry under control of PIL1 native promoter. Scale bars, 2 μm.
FIGURE 9:
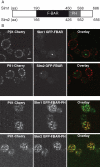
Slms F-BAR domains are required for targeting to eisosomes. (A) Cartoon representation of Slm1 and Slm2 domains analyzed in this work. (B) Representative confocal mid section micrographs of Pil1-Cherry cells expressing N-terminally tagged Slm1 and Slm2 F-BAR (top) and F-BAR-PH (bottom) domains. Scale bar, 2 μm.
Similar articles
- Eisosome-driven plasma membrane organization is mediated by BAR domains.
Ziółkowska NE, Karotki L, Rehman M, Huiskonen JT, Walther TC. Ziółkowska NE, et al. Nat Struct Mol Biol. 2011 Jun 19;18(7):854-6. doi: 10.1038/nsmb.2080. Nat Struct Mol Biol. 2011. PMID: 21685922 - Seg1 controls eisosome assembly and shape.
Moreira KE, Schuck S, Schrul B, Fröhlich F, Moseley JB, Walther TC, Walter P. Moreira KE, et al. J Cell Biol. 2012 Aug 6;198(3):405-20. doi: 10.1083/jcb.201202097. J Cell Biol. 2012. PMID: 22869600 Free PMC article. - Eisosomes are dynamic plasma membrane domains showing pil1-lsp1 heteroligomer binding equilibrium.
Olivera-Couto A, Salzman V, Mailhos M, Digman MA, Gratton E, Aguilar PS. Olivera-Couto A, et al. Biophys J. 2015 Apr 7;108(7):1633-1644. doi: 10.1016/j.bpj.2015.02.011. Biophys J. 2015. PMID: 25863055 Free PMC article. - Insights into eisosome assembly and organization.
E R M, K T K. E R M, et al. J Biosci. 2012 Jun;37(2):295-500. doi: 10.1007/s12038-012-9206-6. J Biosci. 2012. PMID: 22581335 Review. - MCC/Eisosomes Regulate Cell Wall Synthesis and Stress Responses in Fungi.
Foderaro JE, Douglas LM, Konopka JB. Foderaro JE, et al. J Fungi (Basel). 2017 Nov 3;3(4):61. doi: 10.3390/jof3040061. J Fungi (Basel). 2017. PMID: 29371577 Free PMC article. Review.
Cited by
- Phosphorylation by the stress-activated MAPK Slt2 down-regulates the yeast TOR complex 2.
Leskoske KL, Roelants FM, Emmerstorfer-Augustin A, Augustin CM, Si EP, Hill JM, Thorner J. Leskoske KL, et al. Genes Dev. 2018 Dec 1;32(23-24):1576-1590. doi: 10.1101/gad.318709.118. Epub 2018 Nov 26. Genes Dev. 2018. PMID: 30478248 Free PMC article. - Analysis of the roles of phosphatidylinositol-4,5-_bis_phosphate and individual subunits in assembly, localization, and function of Saccharomyces cerevisiae target of rapamycin complex 2.
Martinez Marshall MN, Emmerstorfer-Augustin A, Leskoske KL, Zhang LH, Li B, Thorner J. Martinez Marshall MN, et al. Mol Biol Cell. 2019 Jun 1;30(12):1555-1574. doi: 10.1091/mbc.E18-10-0682. Epub 2019 Apr 10. Mol Biol Cell. 2019. PMID: 30969890 Free PMC article. - Conformation-dependent partitioning of yeast nutrient transporters into starvation-protective membrane domains.
Gournas C, Gkionis S, Carquin M, Twyffels L, Tyteca D, André B. Gournas C, et al. Proc Natl Acad Sci U S A. 2018 Apr 3;115(14):E3145-E3154. doi: 10.1073/pnas.1719462115. Epub 2018 Mar 20. Proc Natl Acad Sci U S A. 2018. PMID: 29559531 Free PMC article. - A role for eisosomes in maintenance of plasma membrane phosphoinositide levels.
Fröhlich F, Christiano R, Olson DK, Alcazar-Roman A, DeCamilli P, Walther TC. Fröhlich F, et al. Mol Biol Cell. 2014 Sep 15;25(18):2797-806. doi: 10.1091/mbc.E13-11-0639. Epub 2014 Jul 23. Mol Biol Cell. 2014. PMID: 25057013 Free PMC article. - Thermodynamics and Free Energy Landscape of BAR-Domain Dimerization from Molecular Simulations.
Jhaveri A, Maisuria D, Varga M, Mohammadyani D, Johnson ME. Jhaveri A, et al. J Phys Chem B. 2021 Apr 22;125(15):3739-3751. doi: 10.1021/acs.jpcb.0c10992. Epub 2021 Apr 7. J Phys Chem B. 2021. PMID: 33826319 Free PMC article.
References
- Abascal F, Zardoya R, Posada D. ProtTest: selection of best-fit models of protein evolution. Bioinformatics. 2005;21:2104–2105. - PubMed
Publication types
MeSH terms
Substances
LinkOut - more resources
Full Text Sources
Other Literature Sources
Molecular Biology Databases
Miscellaneous
