Predicting a human gut microbiota's response to diet in gnotobiotic mice - PubMed (original) (raw)
Predicting a human gut microbiota's response to diet in gnotobiotic mice
Jeremiah J Faith et al. Science. 2011.
Abstract
The interrelationships between our diets and the structure and operations of our gut microbial communities are poorly understood. A model community of 10 sequenced human gut bacteria was introduced into gnotobiotic mice, and changes in species abundance and microbial gene expression were measured in response to randomized perturbations of four defined ingredients in the host diet. From the responses, we developed a statistical model that predicted over 60% of the variation in species abundance evoked by diet perturbations, and we were able to identify which factors in the diet best explained changes seen for each community member. The approach is generally applicable, as shown by a follow-up study involving diets containing various mixtures of pureed human baby foods.
Figures
Fig. 1
Total community abundance (biomass) and the abundance of each community member can best be explained by changes in casein. (A) The total DNA yield per fecal pellet increased as the amount of casein in the host diet increased (shown are mean± S.E.M. for each tested concentration of casein). (B) Changes in species abundance as a function of changes in the concentration of casein in the host diet were also apparent for all 10 species; 7 species were positively correlated with casein concentration (e.g., B. caccae) while the remaining three species were negatively correlated with casein concentration (e.g. E. rectale). Data points from the first and second set of mice given the refined diets (see Fig. S1D,E for explanation) are shown in purple and green, respectively, while the mean and standard error for all diets at a given concentration of casein are shown in red and tan, respectively.
Fig. 2
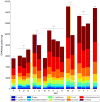
Mean community member abundance for each diet. The height of each bar indicates the total DNA yield/biomass for a given diet. Casein concentrations (g/kg) for each diet are displayed in gray above each bar. See Fig. S1 and Table S1 for a description of diets A–Q.
Fig. 3
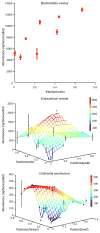
Example of community member responses to complex human foods. Changes in species abundance as a function of diet ingredients were apparent for all 10 species (Table S9). B. ovatus increased in absolute abundance with increased concentration of oats in the diet (upper panel), while most of the ten bacterial species (including E. rectale and C. aerofaciens; middle and lower panels) responded to multiple ingredients. The mean and standard error for all diets are plotted (no error bars are shown when replicate points are not available). The colored z-axis mesh grid on the 3D plots is a triangle-based linear interpolation of the data with color changes corresponding to the values in the color bar on the right.
Similar articles
- Extensive personal human gut microbiota culture collections characterized and manipulated in gnotobiotic mice.
Goodman AL, Kallstrom G, Faith JJ, Reyes A, Moore A, Dantas G, Gordon JI. Goodman AL, et al. Proc Natl Acad Sci U S A. 2011 Apr 12;108(15):6252-7. doi: 10.1073/pnas.1102938108. Epub 2011 Mar 21. Proc Natl Acad Sci U S A. 2011. PMID: 21436049 Free PMC article. - Metabolic niche of a prominent sulfate-reducing human gut bacterium.
Rey FE, Gonzalez MD, Cheng J, Wu M, Ahern PP, Gordon JI. Rey FE, et al. Proc Natl Acad Sci U S A. 2013 Aug 13;110(33):13582-7. doi: 10.1073/pnas.1312524110. Epub 2013 Jul 29. Proc Natl Acad Sci U S A. 2013. PMID: 23898195 Free PMC article. - Linking long-term dietary patterns with gut microbial enterotypes.
Wu GD, Chen J, Hoffmann C, Bittinger K, Chen YY, Keilbaugh SA, Bewtra M, Knights D, Walters WA, Knight R, Sinha R, Gilroy E, Gupta K, Baldassano R, Nessel L, Li H, Bushman FD, Lewis JD. Wu GD, et al. Science. 2011 Oct 7;334(6052):105-8. doi: 10.1126/science.1208344. Epub 2011 Sep 1. Science. 2011. PMID: 21885731 Free PMC article. Clinical Trial. - Evolution of the gut microbiota and the influence of diet.
Rothe M, Blaut M. Rothe M, et al. Benef Microbes. 2013 Mar 1;4(1):31-7. doi: 10.3920/BM2012.0029. Benef Microbes. 2013. PMID: 23257016 Review. - Creating and characterizing communities of human gut microbes in gnotobiotic mice.
Faith JJ, Rey FE, O'Donnell D, Karlsson M, McNulty NP, Kallstrom G, Goodman AL, Gordon JI. Faith JJ, et al. ISME J. 2010 Sep;4(9):1094-8. doi: 10.1038/ismej.2010.110. Epub 2010 Jul 22. ISME J. 2010. PMID: 20664551 Free PMC article. Review. No abstract available.
Cited by
- How informative is the mouse for human gut microbiota research?
Nguyen TL, Vieira-Silva S, Liston A, Raes J. Nguyen TL, et al. Dis Model Mech. 2015 Jan;8(1):1-16. doi: 10.1242/dmm.017400. Dis Model Mech. 2015. PMID: 25561744 Free PMC article. Review. - Quantifying the metabolic activities of human-associated microbial communities across multiple ecological scales.
Maurice CF, Turnbaugh PJ. Maurice CF, et al. FEMS Microbiol Rev. 2013 Sep;37(5):830-48. doi: 10.1111/1574-6976.12022. Epub 2013 Apr 22. FEMS Microbiol Rev. 2013. PMID: 23550823 Free PMC article. Review. - The effect of calorie intake, fasting, and dietary composition on metabolic health and gut microbiota in mice.
Zhang Z, Chen X, Loh YJ, Yang X, Zhang C. Zhang Z, et al. BMC Biol. 2021 Mar 19;19(1):51. doi: 10.1186/s12915-021-00987-5. BMC Biol. 2021. PMID: 33740961 Free PMC article. - Metabolic similarity and the predictability of microbial community assembly.
Vila JCC, Goldford J, Estrela S, Bajic D, Sanchez-Gorostiaga A, Damian-Serrano A, Lu N, Marsland R 3rd, Rebolleda-Gomez M, Mehta P, Sanchez A. Vila JCC, et al. bioRxiv [Preprint]. 2023 Oct 28:2023.10.25.564019. doi: 10.1101/2023.10.25.564019. bioRxiv. 2023. PMID: 37961608 Free PMC article. Preprint. - A Guide to Diet-Microbiome Study Design.
Johnson AJ, Zheng JJ, Kang JW, Saboe A, Knights D, Zivkovic AM. Johnson AJ, et al. Front Nutr. 2020 Jun 12;7:79. doi: 10.3389/fnut.2020.00079. eCollection 2020. Front Nutr. 2020. PMID: 32596250 Free PMC article. Review.
References
- Ley RE, Turnbaugh PJ, Klein S, Gordon JI. Nature. 2006;444:1022. - PubMed
- Xavier RJ, Podolsky DK. Nature. 2007;448:427. - PubMed
- Qin J, et al. Nature. 2010;464:59. - PubMed
Publication types
MeSH terms
Substances
Grants and funding
- R01 DK030292/DK/NIDDK NIH HHS/United States
- R01 DK070977/DK/NIDDK NIH HHS/United States
- DK30292/DK/NIDDK NIH HHS/United States
- DK70977/DK/NIDDK NIH HHS/United States
- R01 DK070977-08/DK/NIDDK NIH HHS/United States
- R37 DK030292-31/DK/NIDDK NIH HHS/United States
- R37 DK030292/DK/NIDDK NIH HHS/United States
LinkOut - more resources
Full Text Sources
Other Literature Sources
Medical
Molecular Biology Databases


