RNA polymerase II kinetics in polo polyadenylation signal selection - PubMed (original) (raw)
RNA polymerase II kinetics in polo polyadenylation signal selection
Pedro A B Pinto et al. EMBO J. 2011.
Abstract
Regulated alternative polyadenylation is an important feature of gene expression, but how gene transcription rate affects this process remains to be investigated. polo is a cell-cycle gene that uses two poly(A) signals in the 3' untranslated region (UTR) to produce alternative messenger RNAs that differ in their 3'UTR length. Using a mutant Drosophila strain that has a lower transcriptional elongation rate, we show that transcription kinetics can determine alternative poly(A) site selection. The physiological consequences of incorrect polo poly(A) site choice are of vital importance; transgenic flies lacking the distal poly(A) signal cannot produce the longer transcript and die at the pupa stage due to a failure in the proliferation of the precursor cells of the abdomen, the histoblasts. This is due to the low translation efficiency of the shorter transcript produced by proximal poly(A) site usage. Our results show that correct polo poly(A) site selection functions to provide the correct levels of protein expression necessary for histoblast proliferation, and that the kinetics of RNA polymerase II have an important role in the mechanism of alternative polyadenylation.
Conflict of interest statement
The authors declare that they have no conflict of interest.
Figures
Figure 1
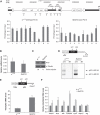
RNA Pol II kinetics with a slower transcription elongation rate affects pA site selection. (A) Pol II ChIP across polo and polo-snap intergenic region. In the top panel, a schematic diagram is shown where polo and snap genes are depicted to scale (adapted from genome.ucsc.edu). ChIP was performed using α-Rpb3 antibody on wild-type (w 1118) and slow Pol II (RpII215 mutant, C4 mutation) adult flies chromatin. Numbers below each graph bar represent the position of real-time PCR primers. (B) RpII215 mutant generates similar levels of polo mRNA as compared with w 1118. Graph represents RT–qPCR quantification of polo mRNAs in adult flies, relative to rp49 mRNA. (C) RpII215 mutant presents similar levels of Polo protein as w 1118. Western blot from total protein extracts of w 1118 and RpII215 third instar larvae brains. MA294 Polo and DM1A α-tubulin antibodies were used. Quantification was made by densitometry (see Materials and methods) and Polo/α-tubulin ratio was set at 1 for w 1118. (D) Representative gel of fractionated 3′RACE products of polo mRNA from w 1118 and RpII215 adult flies is shown. Arrows indicate the bands corresponding to polo pA1 and pA2; −RT is a control reaction without reverse transcriptase. In both panels, phased-anchored oligodT was used for reverse transcription, as depicted in the diagram. (E) RpII215 shows an increase in the ratio of total/pA2 mRNAs. Diagram shows primer positions for qPCR analysis. Levels of total polo mRNAs and pA2 mRNAs were measured by real-time PCR and their ratio (total/pA2) in adult flies is shown. (F) RpII215 shows an increase in proximal site usage in several genes. RT–qPCR quantification was performed as in (E). cDNA synthesis was performed with random primers (see Materials and methods). The ratio for w 1118 was set at 1. For all the panels, error bars show s.e.m. from at least three independent experiments.
Figure 2
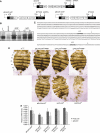
Deletion of polo distal pA2 signal causes abnormal formation of the fly abdomen. (A) Schematic representation of the gfp-polo, Δ_pA1_ and Δ_pA2_ transgenes driven by the endogenous polo promoter. The two pA signals ATTAAA and ATATAA are indicated. In the Δ_pA1_ transgene, the proximal pA signal was mutated to
G
TTAA
C
. (B) Δ_pA1_ and Δ_pA2_ transgenes utilize pA2 and pA1 signals, respectively, as indicated by the arrows. Northern blot of w 1118, gfp-polo, Δ_pA2_ (lines 2.3 and 5) and Δ_pA1_ (lines 12.1 and 9.1) from third instar larvae brains total RNA. The asterisks indicate the two polo mRNAs present in w 1118, the black arrows the shorter transcripts present in Δ_pA2_ lines and the open arrows the longer transcripts present in Δ_pA1_ lines. All fly lines analysed contain the endogenous polo mRNAs that serve as internal controls (denoted by *). (C) polo 3′UTR sequence. Bold sequence indicates proximal (pA1) and distal (pA2) pA signals. The arrows indicate the cleavage site of the transcripts produced by usage of pA1 and pA2. (D) polo pA2 is required for abdominal development. Dorsal view of female abdomens from w 1118 control (panel 1); the seven tergites of the adult abdomen are indicated as A1–A7. Panels 2–4: gfp-polo, Δ_pA1_ (line 12.1) and Δ_pA2_ (line 2.3) individuals in a polo 9/TM6B background. Panels 5–7: gfp-polo, Δ_pA1_ (line 12.1) and Δ_pA2_ (line 2.3) individuals in a polo 9 background. (E) polo mRNA quantification by RT–qPCR in the transgenic fly lines in a polo 9 background. Total RNA was extracted from two adult flies of each genotype (for Δ_pA2_;polo 9, two escapers were used) in a polo 9 background, and from w 1118 flies. After cDNA synthesis with random hexamers, RNA levels were quantified using _gfp_-specific primers for amplification of the transgene-derived transcripts (light grey bars) or primers for exons 4 and 5 for amplification of the total polo RNAs present (dark grey bars). In all genotypes, rp49 was used for normalization. The difference between total polo (dark grey bars) and gfp-polo (light grey bars) corresponds to polo 9 contribution. Error bars show s.e.m. from at least three independent experiments.
Figure 3
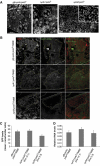
Δ_pA2_ transgene causes a failure in abdominal histoblasts proliferation and produces lower Polo protein levels in histoblasts. (A) Pupa epidermis from gfp-polo, Δ_pA1_ or Δ_pA2_ pupae transgenes in a polo 9 homozygous background was dissected at 26–27 h after pupa formation and stained with DAPI. gfp-polo;polo 9 pupa epidermis exhibited large polyploid nuclei (circled), the larva epidermis cells (LECs). LECs were surrounded by smaller cells (highlighted by dotted lines), which are the proliferating abdominal histoblasts. Δ_pA1_;polo 9 pupa epidermis show a pattern very similar to that observed in gfp-polo;polo 9 tissues. In Δ_pA2;polo_ 9, only LECs are observed, indicating that at this stage, pupa epidermis is mainly composed of larval cells. Scale bar is 50 μm. (B) GFP–Polo expression (green) in abdominal histoblasts in pupae epidermis (26–27 h after pupa formation). Pupae from gfp-polo, Δ_pA1_ (line 12.1) and Δ_pA2_ (line 2.3) transgenic flies in a polo 9 /TM6B background were collected and the epidermis was dissected. The DNA (red) was stained with DAPI. The yellow dotted surrounding area encompasses some of the histoblast cells present in each image. Scale bar is 10 μm. (C) The levels of GFP–Polo were determined in the abdomen histoblasts, by quantification of the GFP fluorescence levels in gfp-polo, Δ_pA1_ (line 12.1) and Δ_pA2_ (line 2.3) pupae in a polo 9/TM6B background, 26–27 h after pupa formation. (D) The levels of gfp-polo transcripts were determined by RT–qPCR in gfp-polo, Δ_pA1_ (line 12.1) and Δ_pA2_ (line 2.3) whole pupae in a polo 9 /TM6B background, 26–27 h after pupa formation. The levels of gfp-polo RNAs were normalized to rp49 RNA. Error bars represent s.e.m. from three independent experiments.
Figure 4
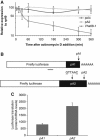
polo pA2 RNA is stable and the corresponding 3′UTR confers higher translability to a reporter gene in Drosophila cells. (A) Endogenous polo pA2 RNA is stable. The decay of the endogenous polo RNAs and Vha68-1 RNA was monitored at the indicated time points after addition of actinomycin D (5 μg/ml). The levels of polo RNAs were normalized to rp49 RNA in three independent experiments and are plotted against time. RNA half-lives (_t_1/2), calculated from the decay curves, are longer than 6 h, except for Vha68-1 that is ∼30 min. (B) Representation of the firefly luciferase reporter constructs with the shorter polo 3′UTR (pA1) or the longer polo 3′UTR (pA2) (pA1 signal mutation: ATTAAA to GTTAAC). The region for specific qPCR primers is underlined. (C) pA1 produces three-fold less protein than pA2. Kc cells were transfected with the pA1 and pA2 reporters and 3 days later firefly luciferase activity and the corresponding mRNA levels were measured. Y axis represents luciferase values normalized to the mRNA levels. Error bars represent s.e.m. from at least three independent experiments.
Figure 5
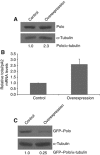
Overexpression of polo leads to an increase in pA1 utilization and a reduction in GFP–Polo protein levels. (A) MZ1061-Gal4;UAS-polo:polo 9 overexpresses Polo. L3 brains were analysed by western blot and a 2.3-fold increase in Polo was observed in comparison with the control—w 1118. Quantification was made by densitometry (see Materials and methods) and Polo/α-tubulin ratio was set at 1. Polo was detected with MA294 and α-tubulin with DM1A antibodies. (B) Overexpression of Polo causes a switch in the pAs ratio. Total RNA was extracted from L3 larvae brains of the MZ1061-Gal4;gfp-polo:polo 9/UAS-polo:polo 9 progeny (labelled as overexpression in the figure). The strain MZ1061-Gal4;gfp-polo:polo 9 was used as control. Total/pA2 mRNA levels were quantified by RT–qPCR with specific primers for both transcripts in the coding sequence and primers between the two pAs. A 2.5-fold change was detected in comparison with the control. (C) GFP–Polo protein expression was analysed by western blot, using the same conditions as in (A). When polo is overexpressed, a four-fold decrease in GFP–Polo is observed.
Figure 6
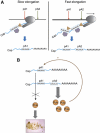
Proposed working model for the role of Pol II kinetics on pA site selection. (A) When Pol II elongation rate is low, Pol II spends more time transcribing polo allowing the pA factors (represented by a triangle and an hexagon) to assemble on the pA1 signal presented by the nascent pre-mRNA, leading to an increase in pA1 utilization, and therefore producing four-fold more polo pA1 mRNA. In conditions where Pol II processivity is high, Pol II transcribes more rapidly through pA1 and pA2. Under these conditions, both pA1 and pA2 signals are present on the nascent transcript and exposed to the polyadenylation machinery at the same time. Consequently, both polo pA1 and pA2 mRNAs are formed. (B) The longer polo mRNA, produced by pA2 signal selection and containing a longer 3′UTR, is more efficiently translated into protein than the shorter pA1 mRNA. Consequently, selection of pA2 is important for the viability of the fly. Levels of Polo protein are controlled by a negative feedback loop mechanism via pA site selection; in the presence of high levels of Polo, pA1 signal is predominantly selected, causing a decrease in the levels of Polo protein produced.
Similar articles
- Integrating transcription kinetics with alternative polyadenylation and cell cycle control.
Moreira A. Moreira A. Nucleus. 2011 Nov-Dec;2(6):556-61. doi: 10.4161/nucl.2.6.18064. Epub 2011 Nov 1. Nucleus. 2011. PMID: 22127258 Review. - Cell Cycle Kinase Polo Is Controlled by a Widespread 3' Untranslated Region Regulatory Sequence in Drosophila melanogaster.
Oliveira MS, Freitas J, Pinto PAB, de Jesus A, Tavares J, Pinho M, Domingues RG, Henriques T, Lopes C, Conde C, Sunkel CE, Moreira A. Oliveira MS, et al. Mol Cell Biol. 2019 Jul 16;39(15):e00581-18. doi: 10.1128/MCB.00581-18. Print 2019 Aug 1. Mol Cell Biol. 2019. PMID: 31085682 Free PMC article. - Transcription elongation rate has a tissue-specific impact on alternative cleavage and polyadenylation in Drosophila melanogaster.
Liu X, Freitas J, Zheng D, Oliveira MS, Hoque M, Martins T, Henriques T, Tian B, Moreira A. Liu X, et al. RNA. 2017 Dec;23(12):1807-1816. doi: 10.1261/rna.062661.117. Epub 2017 Aug 29. RNA. 2017. PMID: 28851752 Free PMC article. - Implications of polyadenylation in health and disease.
Curinha A, Oliveira Braz S, Pereira-Castro I, Cruz A, Moreira A. Curinha A, et al. Nucleus. 2014;5(6):508-19. doi: 10.4161/nucl.36360. Epub 2014 Oct 31. Nucleus. 2014. PMID: 25484187 Free PMC article. Review. - Evolution of Hox post-transcriptional regulation by alternative polyadenylation and microRNA modulation within 12 Drosophila genomes.
Patraquim P, Warnefors M, Alonso CR. Patraquim P, et al. Mol Biol Evol. 2011 Sep;28(9):2453-60. doi: 10.1093/molbev/msr073. Epub 2011 Mar 24. Mol Biol Evol. 2011. PMID: 21436120
Cited by
- Application of the iPLUS non-coding sequence in improving biopharmaceuticals production.
Reis-Claro I, Silva MI, Moutinho A, Garcia BC, Pereira-Castro I, Moreira A. Reis-Claro I, et al. Front Bioeng Biotechnol. 2024 Feb 6;12:1355957. doi: 10.3389/fbioe.2024.1355957. eCollection 2024. Front Bioeng Biotechnol. 2024. PMID: 38380261 Free PMC article. - Conserved long-range base pairings are associated with pre-mRNA processing of human genes.
Kalmykova S, Kalinina M, Denisov S, Mironov A, Skvortsov D, Guigó R, Pervouchine D. Kalmykova S, et al. Nat Commun. 2021 Apr 16;12(1):2300. doi: 10.1038/s41467-021-22549-7. Nat Commun. 2021. PMID: 33863890 Free PMC article. - Regulation and function of alternative polyadenylation in development and differentiation.
Gallicchio L, Olivares GH, Berry CW, Fuller MT. Gallicchio L, et al. RNA Biol. 2023 Jan;20(1):908-925. doi: 10.1080/15476286.2023.2275109. Epub 2023 Oct 31. RNA Biol. 2023. PMID: 37906624 Free PMC article. Review. - Sequential Polyadenylation to Enable Alternative mRNA 3' End Formation.
Hao Y, Cai T, Liu C, Zhang X, Fu XD. Hao Y, et al. Mol Cells. 2023 Jan 31;46(1):57-64. doi: 10.14348/molcells.2023.2176. Epub 2023 Jan 3. Mol Cells. 2023. PMID: 36697238 Free PMC article. Review. - Embryo polarity in moth flies and mosquitoes relies on distinct old genes with localized transcript isoforms.
Yoon Y, Klomp J, Martin-Martin I, Criscione F, Calvo E, Ribeiro J, Schmidt-Ott U. Yoon Y, et al. Elife. 2019 Oct 8;8:e46711. doi: 10.7554/eLife.46711. Elife. 2019. PMID: 31591963 Free PMC article.
References
- Artero R, Furlong EE, Beckett K, Scott MP, Baylies M (2003) Notch and Ras signaling pathway effector genes expressed in fusion competent and founder cells during Drosophila myogenesis. Development 130: 6257–6272 - PubMed
Publication types
MeSH terms
Substances
LinkOut - more resources
Full Text Sources
Molecular Biology Databases
