Transcriptome instability in colorectal cancer identified by exon microarray analyses: Associations with splicing factor expression levels and patient survival - PubMed (original) (raw)
Transcriptome instability in colorectal cancer identified by exon microarray analyses: Associations with splicing factor expression levels and patient survival
Anita Sveen et al. Genome Med. 2011.
Abstract
Background: Colorectal cancer (CRC) is a heterogeneous disease that, on the molecular level, can be characterized by inherent genomic instabilities; chromosome instability and microsatellite instability. In the present study we analyze genome-wide disruption of pre-mRNA splicing, and propose transcriptome instability as a characteristic that is analogous to genomic instability on the transcriptome level.
Methods: Exon microarray profiles from two independent series including a total of 160 CRCs were investigated for their relative amounts of exon usage differences. Each exon in each sample was assigned an alternative splicing score calculated by the FIRMA algorithm. Amounts of deviating exon usage per sample were derived from exons with extreme splicing scores.
Results: There was great heterogeneity within both series in terms of sample-wise amounts of deviating exon usage. This was strongly associated with the expression levels of approximately half of 280 splicing factors (54% and 48% of splicing factors were significantly correlated to deviating exon usage amounts in the two series). Samples with high or low amounts of deviating exon usage, associated with overall transcriptome instability, were almost completely separated into their respective groups by hierarchical clustering analysis of splicing factor expression levels in both sample series. Samples showing a preferential tendency towards deviating exon skipping or inclusion were associated with skewed transcriptome instability. There were significant associations between transcriptome instability and reduced patient survival in both sample series. In the test series, patients with skewed transcriptome instability showed the strongest prognostic association (P = 0.001), while a combination of the two characteristics showed the strongest association with poor survival in the validation series (P = 0.03).
Conclusions: We have described transcriptome instability as a characteristic of CRC. This transcriptome instability has associations with splicing factor expression levels and poor patient survival.
Figures
Figure 1
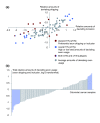
Distribution of relative amounts of deviating exon usage in the CRC test series. The axes represent the log-2 amounts of deviating exon usage relative to the average amount per sample. (a) Sample-wise comparison of deviating exon skipping and inclusion events for the 83 CRCs in the test series. (b) A combination of exon skipping and inclusion events constitutes the total relative amounts of deviating exon usage. Blue bars mark samples with the overall transcriptome instability (oTIN) subtype. TIN, transcriptome instability.
Figure 2
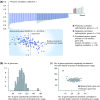
Correlation between the oTIN subtype and expression levels of splicing factors. (a) Pearson correlation coefficients (r) for the 151 splicing factors with expression levels significantly correlated to the total relative amounts of deviating exon usage (P < 0.05). Shown with grey bars are significantly correlated genes representing the median from 100 randomly selected gene sets of equal size (n = 102). Plotted below is the expression level versus deviating exon usage amounts per sample for the splicing factor gene with the strongest correlation (HNRNPUL1, r = -0.63, both axes are median-centered and log-2 transformed). (b) The splicing factor gene set has more genes (n = 151) significantly correlated to the total relative amounts of deviating exon usage than each of 100 random gene sets (range 84 to 124). (c) The splicing factor gene set has more genes with significant negative correlation to deviating exon usage amounts, and fewer genes with significant positive correlation, compared to 100 random gene sets.
Figure 3
Hierarchical clustering analyses of CRC test samples by expression levels of all splicing factors. (a) Unsupervised hierarchical clustering analysis of all 83 CRC samples based on the expression levels of all 280 splicing factor genes separates the samples into clusters with predominantly lower (blue boxes) and higher (red boxes) relative amounts of deviating exon usage than the average sample (black boxes), according to the oTIN subtype. (b) Samples considered to have the oTIN subtype were almost completely separated into two groups with low and high relative amounts of deviating exon usage after hierarchical clustering based on the expression levels of the total set of splicing factors. Both clusters were created using Euclidean distance metrics and complete linkage. MSS, microsatellite stability.
Figure 4
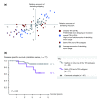
Association between the sTIN subtype and patient survival in the CRC test series. (a) Differences between the amounts of deviating exon inclusion and skipping per sample were used to identify patients with sTIN tumors (threshold at ± 0.7 on the log-ratio scale). (b) Disease-specific survival among patients in the test series stratified by the sTIN subtype. In this analysis, deaths from CRC were considered events (n = 41). Patients who survived throughout the 10 years of follow-up were censored (n = 42). Recurrences (n = 2 among patients who survived) were ignored.
Figure 5
Transcriptome instability in the colorectal cancer validation series. (a) Sample-wise comparison of deviating exon skipping and inclusion events for the 77 CRCs in the validation series. (b) Patients in the validation series whose tumors where characterized with both sTIN and oTIN had a significantly lower 5-year disease-specific survival rate than patients whose tumors were characterized with none or only one of the two TIN subtypes. Deaths from CRC were considered events (n = 10). Censoring occurred at 5 years for survivors (n = 61), and at time of incidence for causes of death other than CRC (n = 6). Recurrences among survivors (n = 9) were ignored.
Similar articles
- Transcriptome instability as a molecular pan-cancer characteristic of carcinomas.
Sveen A, Johannessen B, Teixeira MR, Lothe RA, Skotheim RI. Sveen A, et al. BMC Genomics. 2014 Aug 10;15(1):672. doi: 10.1186/1471-2164-15-672. BMC Genomics. 2014. PMID: 25109687 Free PMC article. - TIN: An R Package for Transcriptome Instability Analysis.
Johannessen B, Sveen A, Skotheim RI. Johannessen B, et al. Cancer Inform. 2015 Sep 20;14:109-12. doi: 10.4137/CIN.S31363. eCollection 2015. Cancer Inform. 2015. PMID: 26448683 Free PMC article. Review. - Deviating Alternative Splicing as a Molecular Subtype of Microsatellite Stable Colorectal Cancer.
Meier Strømme J, Johannessen B, Skotheim RI. Meier Strømme J, et al. JCO Clin Cancer Inform. 2023 Feb;7:e2200159. doi: 10.1200/CCI.22.00159. JCO Clin Cancer Inform. 2023. PMID: 36821799 - Exon-Skipping-Based Subtyping of Colorectal Cancers.
Ambeskovic A, McCall MN, Woodsmith J, Juhl H, Land H. Ambeskovic A, et al. Gastroenterology. 2024 Dec;167(7):1358-1370.e12. doi: 10.1053/j.gastro.2024.08.016. Epub 2024 Aug 23. Gastroenterology. 2024. PMID: 39181169 - Alternative Splicing Events in Tumor Immune Infiltration in Colorectal Cancer.
Shi JY, Bi YY, Yu BF, Wang QF, Teng D, Wu DN. Shi JY, et al. Front Oncol. 2021 Apr 29;11:583547. doi: 10.3389/fonc.2021.583547. eCollection 2021. Front Oncol. 2021. PMID: 33996533 Free PMC article.
Cited by
- MiR-9, -31, and -182 deregulation promote proliferation and tumor cell survival in colon cancer.
Cekaite L, Rantala JK, Bruun J, Guriby M, Agesen TH, Danielsen SA, Lind GE, Nesbakken A, Kallioniemi O, Lothe RA, Skotheim RI. Cekaite L, et al. Neoplasia. 2012 Sep;14(9):868-79. doi: 10.1593/neo.121094. Neoplasia. 2012. PMID: 23019418 Free PMC article. - Transcriptome and Network Dissection of Microsatellite Stable and Highly Instable Colorectal Cancer.
Akbari V, Kallhor M, Mollashahi B, Movafagh A. Akbari V, et al. Asian Pac J Cancer Prev. 2019 Aug 1;20(8):2445-2454. doi: 10.31557/APJCP.2019.20.8.2445. Asian Pac J Cancer Prev. 2019. PMID: 31450919 Free PMC article. - Phospholipase C isozymes are deregulated in colorectal cancer--insights gained from gene set enrichment analysis of the transcriptome.
Danielsen SA, Cekaite L, Ågesen TH, Sveen A, Nesbakken A, Thiis-Evensen E, Skotheim RI, Lind GE, Lothe RA. Danielsen SA, et al. PLoS One. 2011;6(9):e24419. doi: 10.1371/journal.pone.0024419. Epub 2011 Sep 1. PLoS One. 2011. PMID: 21909432 Free PMC article. - Potential role of plasma miR-21 and miR-92a in distinguishing between irritable bowel syndrome, ulcerative colitis, and colorectal cancer.
Ahmed Hassan E, El-Din Abd El-Rehim AS, Mohammed Kholef EF, Abd-Elgwad Elsewify W. Ahmed Hassan E, et al. Gastroenterol Hepatol Bed Bench. 2020 Spring;13(2):147-154. Gastroenterol Hepatol Bed Bench. 2020. PMID: 32308936 Free PMC article. - GUCA2A dysregulation as a promising biomarker for accurate diagnosis and prognosis of colorectal cancer.
Jalali P, Aliyari S, Etesami M, Saeedi Niasar M, Taher S, Kavousi K, Nazemalhosseini Mojarad E, Salehi Z. Jalali P, et al. Clin Exp Med. 2024 Nov 1;24(1):251. doi: 10.1007/s10238-024-01512-y. Clin Exp Med. 2024. PMID: 39485546 Free PMC article.
References
LinkOut - more resources
Full Text Sources
Other Literature Sources
Molecular Biology Databases


