Regulation of yeast chronological life span by TORC1 via adaptive mitochondrial ROS signaling - PubMed (original) (raw)
Regulation of yeast chronological life span by TORC1 via adaptive mitochondrial ROS signaling
Yong Pan et al. Cell Metab. 2011.
Abstract
Here we show that yeast strains with reduced target of rapamycin (TOR) signaling have greater overall mitochondrial electron transport chain activity during growth that is efficiently coupled to ATP production. This metabolic alteration increases mitochondrial membrane potential and reactive oxygen species (ROS) production, which we propose supplies an adaptive signal during growth that extends chronological life span (CLS). In strong support of this concept, uncoupling respiration during growth or increasing expression of mitochondrial manganese superoxide dismutase significantly curtails CLS extension in tor1Δ strains, and treatment of wild-type strains with either rapamycin (to inhibit TORC1) or menadione (to generate mitochondrial ROS) during growth is sufficient to extend CLS. Finally, extension of CLS by reduced TORC1/Sch9p-mitochondrial signaling occurs independently of Rim15p and is not a function of changes in media acidification/composition. Considering the conservation of TOR-pathway effects on life span, mitochondrial ROS signaling may be an important mechanism of longevity regulation in higher organisms.
Copyright © 2011 Elsevier Inc. All rights reserved.
Figures
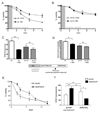
Figure 1. Analysis of Mitochondrial Respiration Parameters in vivo and in vitro in _tor1_Δ and _sch9_Δ Strains
(A) Mitochondrial membrane potential of DBY2006 (wt) and _tor1_Δ strains during mid-log (12 hours after inoculation), late-log, post-diauxic (20 hours after inoculation) and early stationary phase (36 hours after inoculation) measured by DiOC6 staining. (B) Oxygen consumption of DBY2006 (wt) and _tor1_Δ in the presence (TET) or absence (mock) of 100 µM TET. (C) Oxygen consumption of wild-type (wt) and _tor1_Δ in the presence or absence of 10µM DNP. (D) ATP/O ratio of mitochondria isolated from wild-type (wt), _tor1_Δ and _sch9_Δ strains under NADH- or succinate-oxidizing conditions. Error bars represent the mean +/− SD with p-values from a Student’s unpaired t-test denoted as follows (*p < 0.05, **p < 0.01) and “ns” denoting no significance (p > 0.05) between the indicted comparisons. See also Figure S1 and S2.
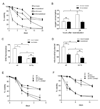
Figure 2. Effects of Uncoupling Respiration on CLS of Wild-type and _tor1_Δ Strains
CLS assays (viability as a function of time after inoculation) of _tor1_Δ (A) or wild-type (B) strains treated with 10µM DNP (_tor1_Δ, DNP) or vehicle (_tor1_Δ, mock) for the first 24 hours post-inoculation (gray box). CLS assays of wild-type (C) or _tor1_Δ (D) strains treated with 10µM DNP from inoculation until termination of the aging experiment. Error bars represent the mean +/− SD.
Figure 3. Coupled Respiration Drives Mitochondria ROS Production in _tor1_Δ Yeast
(A) FACS analysis of DHE-stained wild-type and _tor1_Δ strains during early log (6 hours after inoculation), late log (16 hours after inoculation), post-diauxic (20 hours after inoculation) and stationary phase (36 hours after inoculation). (B) Microscopy of DHE fluorescence in wild-type (top) and _tor1_Δ (bottom) in early log (6 hours after inoculation). Arrows indicate punctate and tubular, mitochondria-like structures. Numbers represent the average percentage of cells displaying more than two foci of DHE fluorescence per cell plus the standard deviation of three biological replicates. Over 200 cells were counted for each replicate. (C) DHE fluorescence of wild-type and _tor1_Δ strains treated with 10µM DNP (+DNP) or vehicle for the first 20 hours of growth. FACS analysis was performed in late-log phase during post-diauxic growth (as indicated to the right). Error bars represent the mean +/− SD with p-values indicated as described in the legend to Figure 1. See also Figure S3.
Figure 4. Elevating Superoxide via Menadione or Rapamycin Treatment Only During Growth Extends CLS of Wild-type Yeast
CLS assays of wild-type (A) or _tor1_Δ (B) strains treated with 1µM menadione (MD) or vehicle (mock) for the first 24 hours of growth (grey box). (C) FACS analysis of stationary phase DHE staining of wild-type (wt) and _tor1_Δ strains that were treated with menadione (+MD) or vehicle for the first 24 hours of growth. (D) Stationary phase mitochondrial membrane potential measured by DiOC6 fluorescence of wild-type and _tor1_Δ strains treated as described in (C). (E) CLS assays of a wild-type strain treated with 200 nM rapamycin or vehicle (mock) for the first 24 hours of growth (gray box). (F) DHE fluorescence of a wild-type strain treated with rapamycin or vehicle (mock) for the first 24 hours of growth. Bars on the left indicate DHE staining during growth with and without rapamycin treatment; bars on the right indicate DHE staining in stationary phase following rapamycin treatment during growth. Error bars represent the mean +/− SD with p-values indicated as described in the legend to Figure 1. See also Figure S4.
Figure 5. Media Acidification Limits Chronological Life Span in Synthetic Dextrose Medium, But Extended CLS in _tor1_Δ and _sch9_Δ Strains is Due to Cell-intrinsic Effects
(A) CLS curves of wild-type (wt) and _tor1_Δ in un-neutralized (mock) and NaOH neutralized (neutralized) SD media. Media was neutralized at the beginning of stationary phase. (B) Oxygen consumption of neutralized (wt neutralized) or not (wt mock treated) wild-type cells 4 and 24 hours after neutralization. (C) Stationary phase cellular superoxide of wild-type (wt) and _tor1_Δ cells neutralized or untreated (mock). (D) Mitochondrial membrane potential of cells treated as described in (C). (E) CLS of wild-type and _tor1_Δ in original media (open symbols) or subjected to media swap (swap) in stationary phase. (F) Same as (E), except wild-type and _sch9_Δ strains were analyzed. Error bars represent the mean +/− SD with p-values indicated as described in the legend to Figure 1. See also Figure S5 and S6.
Figure 6. The Reduced Chronological Life Span of a _rim15_Δ Strain is Rescued by Deletion of SCH9 Via Effects on Mitochondrial Respiration and ROS
(A) Chronological life span, (B) mitochondrial oxygen consumption, (C) mitochondrial membrane potential, (D) MitoSox fluorescence, and (E) DHE fluorescence of DBY2006 (wt) and isogenic _rim15_Δ, _sch9_Δ and rim15_Δ/sch9_Δ strains. Mitochondrial parameters were measured in early stationary phase as described in Materials and Methods. Error bars represent the mean +/− SD with p-values indicated as described in the legend to Figure 1. See also Figure S7.
Figure 7. Adaptive Mitochondrial ROS Signaling and Activation of Rim15p-dependent Stress Responses Collaborate to Mediate CLS Extension by Reduced TORC1 Signaling
A speculative model of how reduced TORC1 signaling extends CLS by activating both adaptive mitochondrial ROS signaling (right arm) and Rim15-dependent stress-resistance pathways (left arm). These responses would cooperate in CLS extension by enhancing ROS detoxification and stress resistance and by an adaptive response to elevated cellular superoxide during growth that alters mitochondria function to decrease membrane potential and produce fewer ROS. This adaptive signal may activate some redox-sensitve factor that controls nuclear-encoded mitochondria and/or stress response genes (horizontal arrow), perhaps via epigenetic regulation, and results in altered respiration and enhanced stress responses in stationary phase. This model is meant to encapsulate those aspects of CLS extension by TOR inhibition involving ROS, mitochondria and oxidative-stress resistance. We acknowledge that reduced TOR signaling has other effects on cell physiology that are also important for CLS that are not pictured here.
Comment in
- A radical role for TOR in longevity.
Lamming DW, Sabatini DM. Lamming DW, et al. Cell Metab. 2011 Jun 8;13(6):617-8. doi: 10.1016/j.cmet.2011.05.006. Cell Metab. 2011. PMID: 21641542 Free PMC article.
Similar articles
- Extension of chronological life span by reduced TOR signaling requires down-regulation of Sch9p and involves increased mitochondrial OXPHOS complex density.
Pan Y, Shadel GS. Pan Y, et al. Aging (Albany NY). 2009 Jan 28;1(1):131-45. doi: 10.18632/aging.100016. Aging (Albany NY). 2009. PMID: 20157595 Free PMC article. - Reduced TOR signaling extends chronological life span via increased respiration and upregulation of mitochondrial gene expression.
Bonawitz ND, Chatenay-Lapointe M, Pan Y, Shadel GS. Bonawitz ND, et al. Cell Metab. 2007 Apr;5(4):265-77. doi: 10.1016/j.cmet.2007.02.009. Cell Metab. 2007. PMID: 17403371 Free PMC article. - Mitochondrial respiratory thresholds regulate yeast chronological life span and its extension by caloric restriction.
Ocampo A, Liu J, Schroeder EA, Shadel GS, Barrientos A. Ocampo A, et al. Cell Metab. 2012 Jul 3;16(1):55-67. doi: 10.1016/j.cmet.2012.05.013. Cell Metab. 2012. PMID: 22768839 Free PMC article. - Metabolic regulation, mitochondria and the life-prolonging effect of rapamycin: a mini-review.
Pan Y, Nishida Y, Wang M, Verdin E. Pan Y, et al. Gerontology. 2012;58(6):524-30. doi: 10.1159/000342204. Epub 2012 Aug 30. Gerontology. 2012. PMID: 22947849 Review. - Mitochondria, reactive oxygen species, and chronological aging: a message from yeast.
Pan Y. Pan Y. Exp Gerontol. 2011 Nov;46(11):847-52. doi: 10.1016/j.exger.2011.08.007. Epub 2011 Aug 22. Exp Gerontol. 2011. PMID: 21884780 Review.
Cited by
- The metabolism beyond programmed cell death in yeast.
Ring J, Sommer C, Carmona-Gutierrez D, Ruckenstuhl C, Eisenberg T, Madeo F. Ring J, et al. Exp Cell Res. 2012 Jul 1;318(11):1193-200. doi: 10.1016/j.yexcr.2012.03.019. Epub 2012 Mar 27. Exp Cell Res. 2012. PMID: 22480867 Free PMC article. Review. - Transcript and protein expression decoupling reveals RNA binding proteins and miRNAs as potential modulators of human aging.
Wei YN, Hu HY, Xie GC, Fu N, Ning ZB, Zeng R, Khaitovich P. Wei YN, et al. Genome Biol. 2015 Feb 22;16(1):41. doi: 10.1186/s13059-015-0608-2. Genome Biol. 2015. PMID: 25853883 Free PMC article. - Complementary roles of mitochondrial respiration and ROS signaling on cellular aging and longevity.
Barrientos A. Barrientos A. Aging (Albany NY). 2012 Sep;4(9):578-9. doi: 10.18632/aging.100485. Aging (Albany NY). 2012. PMID: 22983483 Free PMC article. - Conserved role of medium acidification in chronological senescence of yeast and mammalian cells.
Fabrizio P, Wei M. Fabrizio P, et al. Aging (Albany NY). 2011 Dec;3(12):1127-9. doi: 10.18632/aging.100412. Aging (Albany NY). 2011. PMID: 22184281 Free PMC article. No abstract available. - Growth culture conditions and nutrient signaling modulating yeast chronological longevity.
Santos J, Leão C, Sousa MJ. Santos J, et al. Oxid Med Cell Longev. 2012;2012:680304. doi: 10.1155/2012/680304. Epub 2012 Aug 9. Oxid Med Cell Longev. 2012. PMID: 22928083 Free PMC article. Review.
References
- Aerts AM, Zabrocki P, Govaert G, Mathys J, Carmona-Gutierrez D, Madeo F, Winderickx J, Cammue BP, Thevissen K. Mitochondrial dysfunction leads to reduced chronological lifespan and increased apoptosis in yeast. FEBS Lett. 2009;583:113–117. - PubMed
- Agarwal S, Sharma S, Agrawal V, Roy N. Caloric restriction augments ROS defense in S. cerevisiae, by a Sir2p independent mechanism. Free Radic Res. 2005;39:55–62. - PubMed
- Balaban RS, Nemoto S, Finkel T. Mitochondria, oxidants, and aging. Cell. 2005;120:483–495. - PubMed
- Barros MH, Bandy B, Tahara EB, Kowaltowski AJ. Higher respiratory activity decreases mitochondrial reactive oxygen release and increases life span in Saccharomyces cerevisiae. J Biol Chem. 2004;279:49883–49888. - PubMed
- Beck T, Hall MN. The TOR signalling pathway controls nuclear localization of nutrient-regulated transcription factors. Nature. 1999;402:689–692. - PubMed
Publication types
MeSH terms
Substances
Grants and funding
- P01 ES011163/ES/NIEHS NIH HHS/United States
- P01 ES011163-09/ES/NIEHS NIH HHS/United States
- P01 ES-011163/ES/NIEHS NIH HHS/United States
- T32 GM007499/GM/NIGMS NIH HHS/United States
LinkOut - more resources
Full Text Sources
Other Literature Sources
Molecular Biology Databases


