FGF15/19 regulates hepatic glucose metabolism by inhibiting the CREB-PGC-1α pathway - PubMed (original) (raw)
. 2011 Jun 8;13(6):729-38.
doi: 10.1016/j.cmet.2011.03.019.
Jamie Boney-Montoya, Mihwa Choi, Tianteng He, Nishanth E Sunny, Santhosh Satapati, Kelly Suino-Powell, H Eric Xu, Robert D Gerard, Brian N Finck, Shawn C Burgess, David J Mangelsdorf, Steven A Kliewer
Affiliations
- PMID: 21641554
- PMCID: PMC3131185
- DOI: 10.1016/j.cmet.2011.03.019
FGF15/19 regulates hepatic glucose metabolism by inhibiting the CREB-PGC-1α pathway
Matthew J Potthoff et al. Cell Metab. 2011.
Abstract
Regulation of hepatic carbohydrate homeostasis is crucial for maintaining energy balance in the face of fluctuating nutrient availability. Here, we show that the hormone fibroblast growth factor 15/19 (FGF15/19), which is released postprandially from the small intestine, inhibits hepatic gluconeogenesis, like insulin. However, unlike insulin, which peaks in serum 15 min after feeding, FGF15/19 expression peaks approximately 45 min later, when bile acid concentrations increase in the small intestine. FGF15/19 blocks the expression of genes involved in gluconeogenesis through a mechanism involving the dephosphorylation and inactivation of the transcription factor cAMP regulatory element-binding protein (CREB). This in turn blunts expression of peroxisome proliferator-activated receptor γ coactivator-1α (PGC-1α) and other genes involved in hepatic metabolism. Overexpression of PGC-1α blocks the inhibitory effect of FGF15/19 on gluconeogenic gene expression. These results demonstrate that FGF15/19 works subsequent to insulin as a postprandial regulator of hepatic carbohydrate homeostasis.
Copyright © 2011 Elsevier Inc. All rights reserved.
Figures
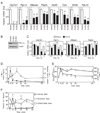
Figure 1. FGF15/19 represses PGC-1α and gluconeogenic gene expression
(A) Hepatic gene expression measured by QPCR in mice treated with vehicle, FGF15 or FGF19 for 6 hr (n = 4/group). Mice were fasted during the treatment period. (B) Western blot analysis of PGC-1α in liver homogenates pooled from groups of 4 mice treated with vehicle, FGF15 or FGF19 as in (A). (C) Hepatic gene expression measured by QPCR in overnight fasted mice injected with FGF19 for the indicated times (n = 4/group). (D) Ileum Fgf15 mRNA and plasma insulin levels from fasted-refed mice at the indicated times after refeeding (n = 5/group). (E) Plasma glucose and glucagon levels from fasted-refed mice at the indicated times after refeeding (n = 5/group). (F) Quantification of hepatic phospho-Akt/total Akt, phospho-ERK1/2/total ERK1/2, and phospho-CREB/total CREB from fasted-refed mice at the indicated times after refeeding (n = 4/group). Data are shown as percent of maximal phosphorylation for each protein and represent the mean ± SEM. Different lowercase letters indicate statistical significance (a, P< 0.05; b, P< 0.01; c, P< 0.005; and d, P< 0.001 versus control). See also Fig. S1.
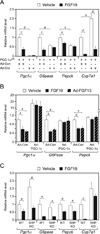
Figure 2. PGC-1α, but not SHP, is required for FGF15/19 regulation of metabolic gene expression
(A) Hepatic gene expression analyzed by QPCR in groups of PGC-1afl/fl mice administered control (Ad-Con) or Cre-expressing (Ad-Cre) adenovirus and subsequently administered vehicle or FGF19 for 6 hr (n = 5–6/group). Mice were fasted during the treatment period. (B) Hepatic gene expression analyzed by QPCR in groups of wild-type (WT) mice infected with Ad-Con or PGC-1α-expressing adenovirus (Ad-PGC-1α) and subsequently administered vehicle or FGF19 for 6 hr. Mice were fasted during the treatment period. Subgroups of the Ad-Con and Ad-PGC-1α groups were co-administered an FGF15-expressing adenovirus (Ad-FGF15). All mice were fasted during the last 6 hr of the experiment (n = 5–7/group). (C) Hepatic gene expression analyzed by QPCR in groups of WT and SHP-KO mice administered vehicle or FGF19 for 6 hr (n = 4/group). Mice were fasted during the treatment period. Data are presented as mean ± SEM (a, P< 0.05; b, P< 0.01; c, P< 0.005; d, P< 0.001).
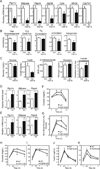
Figure 3. FGF15 represses hepatic gluconeogenesis, TCA cycle flux and fatty acid oxidation
(A) Hepatic gene expression measured by QPCR in mice infected with control (Con) or FGF15-expressing adenovirus (Ad-FGF15) for 3 days and then fasted overnight (n = 5/group). (B) Metabolic pathway flux measured by NMR in perfused livers from mice infected with control or FGF15-expressing adenovirus and fasted as in (A) (n = 8/group). (C) Metabolic parameters in mice infected with control (Con) or FGF15-expressing adenovirus (Ad-FGF15) for 3 days and then fasted for 6 hr (n = 8/group). (D, E) Hepatic gene expression measured by QPCR in fed FGF15-knockout (KO) (D) or FGFR4-KO mice (E) or their wild-type (WT) counterparts (n = 6/group). (F, G) Plasma glucose (F) and mole percent (%) labeled glucose versus unlabeled glucose (G) following a labeled pyruvate/lactate challenge in WT and FGF15-KO mice (n = 5–6/group). (H–K) Plasma glucose and insulin concentrations in fasted-refed WT, FGF15-KO and FGFR4-KO mice at the indicated times after refeeding (n = 6/group). Data are presented as mean ± SEM (a, P< 0.05; b, P< 0.01; c, P< 0.005; d, P< 0.001). See also Fig. S2.
Figure 4. FGF15/19 signaling reduces CREB phosphorylation and activity
(A) Western blot analysis of total and phosphorylated FRS2α, ERK1/2, CREB, Akt, and FOXO1 in liver lysates from individual overnight fasted wild-type (WT) and FGFR4-knockout (KO) mice 30 min after treatment with vehicle or FGF19. β-Actin served as a loading control. (B–E) ChIP analysis of the cyclic AMP response elements (CRE) in the _Pgc1_α, G6pase, and Pepck promoters using CREB, CBP and PGC-1α antibodies as indicated and pooled liver lysates (three repeats/pool; n = 4/pool of each group). For (B), mice were administered saline or FGF19 for 1 hr and fasted during the treatment period. For (C–E), mice were injected with control or FGF15-expressing adenovirus for 3 days and killed after an overnight fast. (F) Images of luciferase activity in mice infected with a CRE-luciferase reporter (Ad-CRE-luc) or control adenovirus and subsequently treated with vehicle or FGF19 for 6 hr. Mice were fasted during the treatment period. (G) Quantified luciferase activity normalized to the number of virus particles per liver (n = 6/group). All data are presented as mean ± SEM (c, P< 0.005). See also Fig. S3.
Similar articles
- FGF21 induces PGC-1alpha and regulates carbohydrate and fatty acid metabolism during the adaptive starvation response.
Potthoff MJ, Inagaki T, Satapati S, Ding X, He T, Goetz R, Mohammadi M, Finck BN, Mangelsdorf DJ, Kliewer SA, Burgess SC. Potthoff MJ, et al. Proc Natl Acad Sci U S A. 2009 Jun 30;106(26):10853-8. doi: 10.1073/pnas.0904187106. Epub 2009 Jun 16. Proc Natl Acad Sci U S A. 2009. PMID: 19541642 Free PMC article. - The SMILE transcriptional corepressor inhibits cAMP response element-binding protein (CREB)-mediated transactivation of gluconeogenic genes.
Lee JM, Han HS, Jung YS, Harris RA, Koo SH, Choi HS. Lee JM, et al. J Biol Chem. 2018 Aug 24;293(34):13125-13133. doi: 10.1074/jbc.RA118.002196. Epub 2018 Jun 27. J Biol Chem. 2018. PMID: 29950523 Free PMC article. - Diminished hepatic gluconeogenesis via defects in tricarboxylic acid cycle flux in peroxisome proliferator-activated receptor gamma coactivator-1alpha (PGC-1alpha)-deficient mice.
Burgess SC, Leone TC, Wende AR, Croce MA, Chen Z, Sherry AD, Malloy CR, Finck BN. Burgess SC, et al. J Biol Chem. 2006 Jul 14;281(28):19000-8. doi: 10.1074/jbc.M600050200. Epub 2006 May 2. J Biol Chem. 2006. PMID: 16670093 Free PMC article. - CITED2 links hormonal signaling to PGC-1α acetylation in the regulation of gluconeogenesis.
Sakai M, Matsumoto M, Tujimura T, Yongheng C, Noguchi T, Inagaki K, Inoue H, Hosooka T, Takazawa K, Kido Y, Yasuda K, Hiramatsu R, Matsuki Y, Kasuga M. Sakai M, et al. Nat Med. 2012 Mar 18;18(4):612-7. doi: 10.1038/nm.2691. Nat Med. 2012. PMID: 22426420 - Integrated regulation of hepatic metabolism by fibroblast growth factor 21 (FGF21) in vivo.
Fisher FM, Estall JL, Adams AC, Antonellis PJ, Bina HA, Flier JS, Kharitonenkov A, Spiegelman BM, Maratos-Flier E. Fisher FM, et al. Endocrinology. 2011 Aug;152(8):2996-3004. doi: 10.1210/en.2011-0281. Epub 2011 Jun 28. Endocrinology. 2011. PMID: 21712364 Free PMC article.
Cited by
- Diet1 is a regulator of fibroblast growth factor 15/19-dependent bile acid synthesis.
Reue K, Lee JM, Vergnes L. Reue K, et al. Dig Dis. 2015;33(3):307-13. doi: 10.1159/000371649. Epub 2015 May 27. Dig Dis. 2015. PMID: 26045262 Free PMC article. - Autophagy in liver diseases: A review.
Qian H, Chao X, Williams J, Fulte S, Li T, Yang L, Ding WX. Qian H, et al. Mol Aspects Med. 2021 Dec;82:100973. doi: 10.1016/j.mam.2021.100973. Epub 2021 Jun 11. Mol Aspects Med. 2021. PMID: 34120768 Free PMC article. Review. - Nuclear receptors HNF4α and LRH-1 cooperate in regulating Cyp7a1 in vivo.
Kir S, Zhang Y, Gerard RD, Kliewer SA, Mangelsdorf DJ. Kir S, et al. J Biol Chem. 2012 Nov 30;287(49):41334-41. doi: 10.1074/jbc.M112.421834. Epub 2012 Oct 4. J Biol Chem. 2012. PMID: 23038264 Free PMC article. - Size matters: the biochemical logic of ligand type in endocrine crosstalk.
Lone JB, Long JZ, Svensson KJ. Lone JB, et al. Life Metab. 2024 Feb;3(1):load048. doi: 10.1093/lifemeta/load048. Epub 2023 Dec 8. Life Metab. 2024. PMID: 38425548 Free PMC article. - Intermittent fasting induces rapid hepatocyte proliferation to restore the hepatostat in the mouse liver.
Sarkar A, Jin Y, DeFelice BC, Logan CY, Yang Y, Anbarchian T, Wu P, Morri M, Neff NF, Nguyen H, Rulifson E, Fish M, Kaye AG, Martínez Jaimes AM, Nusse R. Sarkar A, et al. Elife. 2023 Jan 31;12:e82311. doi: 10.7554/eLife.82311. Elife. 2023. PMID: 36719070 Free PMC article.
References
- Ahren B, Havel PJ. Leptin increases circulating glucose, insulin and glucagon via sympathetic neural activation in fasted mice. Int J Obes Relat Metab Disord. 1999;23:660–665. - PubMed
- Ayala JE, Bracy DP, McGuinness OP, Wasserman DH. Considerations in the design of hyperinsulinemic-euglycemic clamps in the conscious mouse. Diabetes. 2006;55:390–397. - PubMed
- Bittinger MA, McWhinnie E, Meltzer J, Iourgenko V, Latario B, Liu X, Chen CH, Song C, Garza D, Labow M. Activation of cAMP response element-mediated gene expression by regulated nuclear transport of TORC proteins. Curr Biol. 2004;14:2156–2161. - PubMed
Publication types
MeSH terms
Substances
Grants and funding
- P41 RR002584/RR/NCRR NIH HHS/United States
- R01 DK078184-03/DK/NIDDK NIH HHS/United States
- DK078184/DK/NIDDK NIH HHS/United States
- DK078187/DK/NIDDK NIH HHS/United States
- DK076269/DK/NIDDK NIH HHS/United States
- R56 DK078184/DK/NIDDK NIH HHS/United States
- HHMI/Howard Hughes Medical Institute/United States
- U19 DK062434-01/DK/NIDDK NIH HHS/United States
- R01 DK078184/DK/NIDDK NIH HHS/United States
- R01 DK078187-05/DK/NIDDK NIH HHS/United States
- DK067158/DK/NIDDK NIH HHS/United States
- R01 DK067158-09/DK/NIDDK NIH HHS/United States
- U19 DK062434/DK/NIDDK NIH HHS/United States
- R01 DK078187/DK/NIDDK NIH HHS/United States
- U19DK62434/DK/NIDDK NIH HHS/United States
- R01 DK067158/DK/NIDDK NIH HHS/United States
LinkOut - more resources
Full Text Sources
Other Literature Sources
Molecular Biology Databases


