Crystal structure of the MID-PIWI lobe of a eukaryotic Argonaute protein - PubMed (original) (raw)
Crystal structure of the MID-PIWI lobe of a eukaryotic Argonaute protein
Andreas Boland et al. Proc Natl Acad Sci U S A. 2011.
Abstract
Argonaute proteins (AGOs) are essential effectors in RNA-mediated gene silencing pathways. They are characterized by a bilobal architecture, in which one lobe contains the N-terminal and PAZ domains and the other contains the MID and PIWI domains. Here, we present the first crystal structure of the MID-PIWI lobe from a eukaryotic AGO, the Neurospora crassa QDE-2 protein. Compared to prokaryotic AGOs, the domain orientation is conserved, indicating a conserved mode of nucleic acid binding. The PIWI domain shows an adaptable surface loop next to a eukaryote-specific α-helical insertion, which are both likely to contact the PAZ domain in a conformation-dependent manner to sense the functional state of the protein. The MID-PIWI interface is hydrophilic and buries residues that were previously thought to participate directly in the allosteric regulation of guide RNA binding. The interface includes the binding pocket for the guide RNA 5' end, and residues from both domains contribute to binding. Accordingly, micro-RNA (miRNA) binding is particularly sensitive to alteration in the MID-PIWI interface in Drosophila melanogaster AGO1 in vivo. The structure of the QDE-2 MID-PIWI lobe provides molecular and mechanistic insight into eukaryotic AGOs and has significant implications for understanding the role of these proteins in silencing.
Conflict of interest statement
The authors declare no conflict of interest.
Figures
Fig. 1.
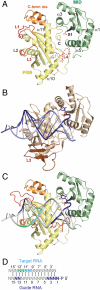
Structure of the Neurospora crassa QDE-2 MID-PIWI lobe. (A) Ribbon representation of the QDE-2 MID-PIWI ΔL3 structure showing the position of a bound sulfate ion (S1) as sticks (red, oxygen; yellow, sulfur). Disordered portions of the polypeptide chains are indicated with dashed lines. Selected loops and secondary structure elements are labeled. Loop L1 is shown in conformation II. Loop L3 was deleted and replaced by a GSG linker. Loop L4 is modeled based on prokaryotic structures [PDB ID code 1W9H (11)]. The eukaryotic-specific insertion is colored orange. (B) Ribbon representation of the MID-PIWI lobe of Thermus thermophilus (Tt) AGO in complex with a guide DNA-target RNA duplex, generated from PDB ID code 3HJF (10). (C, D) Model for a nucleic acid bound to the QDE-2 MID-PIWI lobe, based on the superposition with the Tt PIWI domain (PDB ID code 3HJF, as shown in panel B). Specific bases of the guide DNA and target RNA strands are colored as indicated in panel D. Loop L1 is shown in conformation I.
Fig. 2.
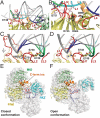
Details of the nucleic acid binding surface. (A) View of the QDE-2 PIWI domain bound to a model guide DNA-target RNA duplex color-coded as in Fig. 1_D_. (B) Expanded view of the framed region in panel A showing the catalytic site of Nc QDE-2 PIWI domain and the position of the backbone phosphate linking the 10′-11′ bases of the target RNA relative to the catalytic residues (D664, D745, and D890). For clarity, loop L1 is colored pink. (C, D) Extended view of loops L1 and L2 in contact with the guide DNA-target RNA duplex. Panel (C) shows loop L1 in conformation I whereas panel D shows conformation II, in which loop L1 clashes with the duplex. (E, F) Relative orientation of eukaryotic AGO domains (ribbons), using bacterial AGO structures as template (transparent surfaces). (E) Closed conformation in the absence of a target strand, where the 3′ end of the guide strand is anchored in the PAZ domain [based on PDB ID code 3DLH (8)]. (F) Open conformation in the presence of a target strand, where the 3′ end of the guide strand is released [based on PDB ID code 3HJF (10)]. Note that in the closed conformation (E), the C-terminal insertion (C-term ins) and loop L1 of the QDE-2 MID-PIWI lobe can contact the PAZ domain. In both panels, loop L1 is shown in the conformation observed in crystal form I. However, in the closed conformation (E) loop L1 could adopt conformation II or any other similar conformation and still contact the PAZ domain.
Fig. 3.
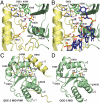
Details of the MID-PIWI interface. (A, B) Extended view of the guide strand 5′-terminal nucleotide-binding pocket, without (A) and with (B) bound guide strand (DNA) model from the superposition of the Tt MID-PIWI domain in complex with a guide-target duplex (Fig. 1_C_). The guide strand is shown as sticks colored according to the scheme in Fig. 1_D_. The 5′ base of the guide strand stacks onto Y595, whereas the 5′ phosphate superimposes with sulfate S1. Relevant side chains are shown as sticks. Hydrogen bonds are shown as dotted lines (red for water w1). The water molecule (w1) is shown in purple, and a magnesium ion from the Tt AGO structure (PDB ID codes 3DLH and 3HJF) is shown in gray (red, oxygen; blue, nitrogen; yellow, sulfur and phosphorus). (C, D) Comparison of QDE-2 MID domain structures in the context of the MID-PIWI lobe (C) or in isolation (D). Loop L _D_603 (dark gray) changes conformation between the two structures. The structure of the isolated QDE-2 MID domain contains two bound sulfate ions (S1 and S2). S1 marks the position of the 5′ phosphate of the guide strand, whereas S2 marks the position of a putative second ligand-binding site [PDB ID code 2xdy (17)]. In the structure of the QDE-2 MID-PIWI lobe, the S2 binding site is occluded by the C-terminal tail of the protein, and S2 is replaced by three water molecules (magenta). Relevant side chains and secondary structure elements are labeled. D603 corresponds to the aspartate proposed by Djuranovic et al. (21) to mediate allosteric regulation of miRNA binding. MID, pale green; PIWI, yellow.
Fig. 4.
Mutational analysis of the Nc QDE-2 MID-PIWI lobe. (A_–_G) A 5′-phosphorylated 10-nucleotide long RNA oligo with a 5′-terminal uridine was analyzed by size exclusion chromatography, either in the absence (dashed red lines) or presence (solid red lines) of the indicated proteins. Proteins analyzed in the presence of the RNA substrate are shown as solid blue lines. Note that the elution volume of the proteins does not change in the presence of nucleic acids. Concentrations were calculated from the relative absorption properties of the components.
Fig. 5.
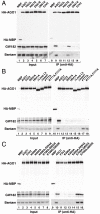
Mutational analysis of Dm AGO1. (A_–_C) Lysates from S2 cells expressing HA-tagged versions of MBP, wild-type AGO1 or AGO1 mutants were immunoprecipitated using a monoclonal anti-HA antibody. Inputs and immunoprecipitates were analyzed by Western blotting. Endogenous GW182 was detected using anti-GW182 antibodies. The association between HA-AGO1 and endogenous Bantam miRNA was analyzed by northern blotting.
Similar articles
- Crystal structure and ligand binding of the MID domain of a eukaryotic Argonaute protein.
Boland A, Tritschler F, Heimstädt S, Izaurralde E, Weichenrieder O. Boland A, et al. EMBO Rep. 2010 Jul;11(7):522-7. doi: 10.1038/embor.2010.81. Epub 2010 Jun 11. EMBO Rep. 2010. PMID: 20539312 Free PMC article. - Crystal Structure of Silkworm PIWI-Clade Argonaute Siwi Bound to piRNA.
Matsumoto N, Nishimasu H, Sakakibara K, Nishida KM, Hirano T, Ishitani R, Siomi H, Siomi MC, Nureki O. Matsumoto N, et al. Cell. 2016 Oct 6;167(2):484-497.e9. doi: 10.1016/j.cell.2016.09.002. Epub 2016 Sep 29. Cell. 2016. PMID: 27693359 - Prokaryotic homologs of Argonaute proteins are predicted to function as key components of a novel system of defense against mobile genetic elements.
Makarova KS, Wolf YI, van der Oost J, Koonin EV. Makarova KS, et al. Biol Direct. 2009 Aug 25;4:29. doi: 10.1186/1745-6150-4-29. Biol Direct. 2009. PMID: 19706170 Free PMC article. - The crystal structure of the Argonaute2 PAZ domain reveals an RNA binding motif in RNAi effector complexes.
Song JJ, Liu J, Tolia NH, Schneiderman J, Smith SK, Martienssen RA, Hannon GJ, Joshua-Tor L. Song JJ, et al. Nat Struct Biol. 2003 Dec;10(12):1026-32. doi: 10.1038/nsb1016. Epub 2003 Nov 16. Nat Struct Biol. 2003. PMID: 14625589 - A long look at short prokaryotic Argonautes.
Koopal B, Mutte SK, Swarts DC. Koopal B, et al. Trends Cell Biol. 2023 Jul;33(7):605-618. doi: 10.1016/j.tcb.2022.10.005. Epub 2022 Nov 22. Trends Cell Biol. 2023. PMID: 36428175 Review.
Cited by
- miRNA-like duplexes as RNAi triggers with improved specificity.
Betancur JG, Yoda M, Tomari Y. Betancur JG, et al. Front Genet. 2012 Jul 12;3:127. doi: 10.3389/fgene.2012.00127. eCollection 2012. Front Genet. 2012. PMID: 22807929 Free PMC article. - Further Elucidation of the Argonaute and Dicer Protein Families in the Model Grass Species Brachypodium distachyon.
Šečić E, Zanini S, Kogel KH. Šečić E, et al. Front Plant Sci. 2019 Oct 22;10:1332. doi: 10.3389/fpls.2019.01332. eCollection 2019. Front Plant Sci. 2019. PMID: 31708948 Free PMC article. - In silico identification, phylogenetic and bioinformatic analysis of argonaute genes in plants.
Mirzaei K, Bahramnejad B, Shamsifard MH, Zamani W. Mirzaei K, et al. Int J Genomics. 2014;2014:967461. doi: 10.1155/2014/967461. Epub 2014 Sep 15. Int J Genomics. 2014. PMID: 25309901 Free PMC article. - microRNA-independent recruitment of Argonaute 1 to nanos mRNA through the Smaug RNA-binding protein.
Pinder BD, Smibert CA. Pinder BD, et al. EMBO Rep. 2013 Jan;14(1):80-6. doi: 10.1038/embor.2012.192. Epub 2012 Nov 27. EMBO Rep. 2013. PMID: 23184089 Free PMC article. - Small-RNA loading licenses Argonaute for assembly into a transcriptional silencing complex.
Holoch D, Moazed D. Holoch D, et al. Nat Struct Mol Biol. 2015 Apr;22(4):328-35. doi: 10.1038/nsmb.2979. Epub 2015 Mar 2. Nat Struct Mol Biol. 2015. PMID: 25730778 Free PMC article.
References
- Tolia NH, Joshua-Tor L. Slicer and the argonautes. Nat Chem Biol. 2007;3:36–43. - PubMed
- Jínek M, Doudna JA. A three-dimensional view of the molecular machinery of RNA interference. Nature. 2009;457:405–412. - PubMed
- Song JJ, Smith SK, Hannon GJ, Joshua-Tor L. Crystal structure of Argonaute and its implications for RISC slicer activity. Science. 2004;305:1434–1437. - PubMed
Publication types
MeSH terms
Substances
LinkOut - more resources
Full Text Sources
Molecular Biology Databases
Research Materials


