Plasma corticosterone activates SGK1 and induces morphological changes in oligodendrocytes in corpus callosum - PubMed (original) (raw)
Plasma corticosterone activates SGK1 and induces morphological changes in oligodendrocytes in corpus callosum
Shingo Miyata et al. PLoS One. 2011.
Abstract
Repeated stressful events are known to be associated with onset of depression. Further, stress activates the hypothalamic-pituitary-adrenocortical (HPA) system by elevating plasma cortisol levels. However, little is known about the related downstream molecular pathway. In this study, by using repeated water-immersion and restraint stress (WIRS) as a stressor for mice, we attempted to elucidate the molecular pathway induced by elevated plasma corticosterone levels. We observed the following effects both, in vivo and in vitro: (1) repeated exposure to WIRS activates the 3-phosphoinositide-dependent protein kinase (PDK1)-serum glucocorticoid regulated kinase (SGK1)-N-myc downstream-regulated gene 1 (NDRG1)-adhesion molecule (i.e., N-cadherin, α-catenin, and β-catenin) stabilization pathway via an increase in plasma corticosterone levels; (2) the activation of this signaling pathway induces morphological changes in oligodendrocytes; and (3) after recovery from chronic stress, the abnormal arborization of oligodendrocytes and depression-like symptoms return to the control levels. Our data strongly suggest that these abnornalities of oligodendrocytes are possibly related to depression-like symptoms.
Conflict of interest statement
Competing Interests: The authors have declared that no competing interests exist.
Figures
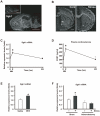
Figure 1. Simple WIRS (acute stress) upregulates Sgk1 predominantly in the fiber tracts via HPA axis activation.
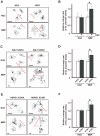
(A, B) In situ hybridization images of Sgk1 mRNA. Dark-field photomicrographs showing the distribution of Sgk1 mRNA-expressing cells in the mouse brain on the sagittal (A) and frontal (B) planes. Sections were hybridized with a 35S-labeled antisense RNA probe for Sgk1 mRNA. As controls, adjacent sections were hybridized with 35S-labeled sense RNA probe (inset in a). Scale bar = 5 mm. (B) Simple exposure to WIRS increased Sgk1 mRNA expression in the mouse brain. cc, corpus callosum; ac, anterior commissure. Scale bar = 2 mm. (C) Relative mRNA expression levels were determined by real-time PCR and normalized to that of GAPDH mRNA. Time-course dependent changes of Sgk1 mRNA levels in the corpus callosum analyzed after simple exposure to WIRS. *p<0.05, _t_-test. (D) Time-course dependent change of plasma corticosterone levels analyzed by the EIA kit after simple exposure to WIRS. *p<0.05, _t_-test. (E) Relative mRNA expression levels were determined by real-time PCR and normalized to that of GAPDH mRNA. Intraperitoneal administration of 3 mg/kg DEX induced Sgk1 mRNA expression in the corpus callosum. *p<0.05, _t_-test. (F) Relative mRNA expression levels were determined by real-time PCR and normalized to that of GAPDH mRNA. Adrenorectomy completely inhibited the upregulation of Sgk1 mRNA after simple exposure to WIRS (compare black bars). *p<0.05, _t_-test.
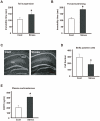
Figure 2. Characterization of model mice exposed to repeated WIRS (chronic stress).
(A, B) Effects of repeated WIRS as chronic stress on mouse behavior. Stressed mice exhibited significantly increased depression-like behavior compared with control mice in tail-suspension (A) and forced-swimming (B) tests. The results are expressed as the mean ± SEM of three independent experiments. *p<0.05, _t_-test. (C) Less adult neural stem cells labeled by BrdU were found in the subgranular zone of the dentate gyrus (DG) in the stressed mice (C, Stress) than in the control mice (C, Cont). BrdU (75 mg/kg) was injected 4 times at 6-h intervals. Scale bars = 500 µm. (D) Quantification of the results shown in C. The results are expressed as the mean ± SEM of three independent experiments. *p<0.05, _t_-test. (E) Alternation of plasma corticosterone 24 h after repeated WIRS. The results are expressed as the mean ± SEM of three independent experiments. *p<0.05, _t_-test.
Figure 3. Repeated exposure to WIRS (chronic stress) upregulates SGK1 and SGK1 is activated by PDK1.
(A, B) In situ hybridization images of Sgk1 mRNA. Dark-field photomicrographs show the upregulation of Sgk1 mRNA expression in the fiber tracts after repeated exposure to WIRS (A, controls; B, stress). cc, corpus callosum; ac, anterior commissure. Scale bar = 5 mm. (C, D) In situ hybridization images of Sgk1 mRNA. Upregulation of Sgk1 mRNA (C) after repeated exposure to WIRS was abolished in the brain of adrenalectomized mice (D). cc, corpus callosum; ac, anterior commissure. Scale bar = 2 mm. (E) Real-time PCR analysis shows a significant increase in Sgk1 mRNA levels in the corpus callosum of mice exposed to repeated WIRS. *p<0.05, _t_-test. (F) Western blot analysis of SGK1 protein in the control and test (repeated exposure to WIRS) mice. (G, H) Western blot analysis shows SGK1 protein, its phosphorylation at positions T-256 (SGK1-256T-P) and S-422 (SGK1-422S-P), and the phosphorylation of PDK1 at position S-241 (PDK-241S-P) in the oligodendrocytes of the corpus callosum after repeated exposure to WIRS. (I, J) Western blot analysis shows that elevated corticosterone levels upregulate the phosphorylation of PDK1 (I) and SGK1 (J) in HEK293 cells with (+) or without (−) DEX treatment (100 µM). Wortmannin (WORT) was used as an inhibitor of the PI3K signaling pathway.
Figure 4. Chronic stress upregulates Sgk1 predominantly in the fiber tracts via HPA axis activation.
(A, B) In situ hybridization images of Sgk1 mRNA. Sgk1 mRNA expression in the corpus callosum (cc) and anterior commissure (ac) was elevated in mice after repeated exposed to WIRS (B) compared with the expression of Sgk1 mRNA in these bundles (A). Scale bar = 2 mm. (C, D) Enlargement of the squares in (A) and (B), respectively. Scale bar = 100 µm. (E, F) Merged images of Nissl staining and in situ hybridization images of Sgk1 mRNA. The distribution of cells expressing Sgk1 mRNA in the corpus callosum of the control (E) and repeated WIRS-exposed mice (F) in bright-filed photomicrographs. Positive grains were concentrated in the oligodendrocytes. Scale bars = 50 µm. (G) Western blot analysis shows that repeated WIRS decreases MBP expression in the corpus callosum compared to the control mice.
Figure 5. Repeated exposure to WIRS upregulates NDRG1 phosphorylation in the fiber tracts via SGK1 activation.
(A) In situ hybridization images of Ndrg1 mRNA. Dark-field photomicrographs show the distribution of Ndrg1 mRNA-expressing cells in the mouse brain on the sagittal plane. Sections were hybridized with 35S-labeled antisense RNA probe for Ndrg1 mRNA. As controls, adjacent sections were hybridized with 35S-labeled sense RNA probe (inset). Scale bar = 5 mm. (B) Immunoprecipitation and western blot analysis show that repeated exposure to WIRS elevated the interaction between SGK1 and NDRG1 (second column). However, NDRG1 expression did not increase in the corpus callosum (first column). (C, D) Real-time PCR analysis (C) and in situ hybridization histochemistry (D) show no alterations in Ndrg1 mRNA levels in the corpus callosum of mice exposed to repeated WIRS (see also first panel of B). cc, corpus callosum; ac, anterior commissure. Scale bar = 2 mm. (E) Western blot analysis shows that repeated exposure to WIRS elevated phosphorylated NDRG1 levels in the corpus callosum. (F) Western blot analysis shows that DEX stimulation for 24 h elevated phosphorylated NDRG1 levels in HEK293 cells (left panels). The active form of SGK1 (SGK1-S422D) or control vector (GFP) were overexpressed in HEK293 cells for 3 days (right panels). Western blot analysis shows that SGK1-S422D overexpressed cells elevated phosphorylated NDRG1 levels. 293; no-stimulation control (HEK293 cells), DEX; 100 µM DEX for 24 h. (G) The negative form of SGK1 (SGK1-S422A) or the active form of SGK1 (SGK1-S422D) were overexpressed in the HEK293 cells expressing wild type NDRG1 (NDRG1-WT) for 3 days. Western blot analysis shows that the active form of SGK1 upregulates the phosphorylation level of the overexpressed wild type NDRG1.
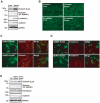
Figure 6. Repeated exposure to WIRS upregulates adhesion molecules expression levels in oligodendrocytes of the fiber tracts.
(A) Immunoprecipitation and western blot analysis show that repeated exposure to WIRS elevated the interaction between NDRG1 and β-catenin (second panel), and that the expression levels of β-catenin, _N_-cadherin, and α-catenin were elevated in the corpus callosum. (B) Immunohistochemical analysis of β-catenin and _N_-cadherin in the corpus callosum demonstrates increased labeling of the processes of the oligodendrocytes (i.e., greater number and intensity) in mice exposed to repeated WIRS. Scale bar = 50 µm. (C, D) Immunocytochemical analysis of β-catenin and _N_-cadherin in SK-N-SH cells overexpressing non-phosphorylated (NDRG1-S330A) or phosphorylated NDRG1 (NDRG1-S330D). Increased expression of β-catenin (C) and _N_-cadherin (D) due to the overexpression of the phosphorylated form of NDRG1 (NDRG1-S330D) were mostly observed on the surfaces of the cell bodies and the processes of SK-N-SH cells. Scale bar = 20 µm. (E) Immunoprecipitation and western blot analysis show that overexpression of phosphorylated NDRG1 (NDRG1-S330D) upregulated the interaction between NDRG1 and β-catenin (second column), and that the expression levels of β-catenin, _N_-cadherin, and α-catenin were elevated in SK-N-SH cells. SK, no-transfection control (SK-N-SH cells).
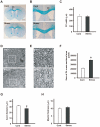
Figure 7. Repeated exposure to WIRS causes morphological alterations in oligodendrocytes in the corpus callosum.
(A, B): Representative histological coronal sections through the forebrain of control (Cont) and repeated WIRS-exposed mice (stress) with Kluver–Barrera stain. No distinct changes were detected in the corpus callosum (cc) between the 2 groups of mice at either lower (A) or higher (B) magnification. Scale bar = 2 mm in (A) and 1 mm in (B). (C) Results of the quantification of the width of the corpus callosum. Results are expressed as the mean ± SEM of 3 independent experiments. (D, E) Representative transverse electron micrographs of the corpus callosum from control (upper panels of D and E) and repeated WIRS-exposed mice (lower panels of D and E). Scale bars = 5 µm. (E) The higher magnification of the square region of (D). Scale bar = 2 µm. (F) Results of the quantification of the sum of oligodendrocytes in the cross-sectional area. The results are expressed as the mean ± SEM of 3 independent experiments. *p<0.05, _t_-test. (G, H) The distributions of the axon diameters (G) and myelin thicknesses (H) of the corpus callosum in the control and repeated WIRS-exposed mice were assessed. The results are expressed as the mean ± SEM of 3 independent experiments. *p<0.05, _t_-test.
Figure 8. Activation of the SGK1-NDRG1 pathway also causes morphological changes in primary cultured oligodendrocytes.
(A, C, E) Morphology of primary cultured oligodendrocytes treated with (+DEX) (a, right column) or without DEX (-DEX) for 2 days (A, left column). Overexpression of the active form of SGK1 (SGK1-S422D) (C, right column) and overexpression of phosphorylated NDRG1 (NDRG1-S330D) (E, right column) by using the ImageJ tracing tool. As controls for the last 2 experiments, the effects of the overexpression of SGK1-S422A (the inactive form of SGK1) (C, left column) and NDRG1-S330A (the non-phosphorylated form of NDRG1) (E, left column) were examined. NG2 and MBP were used as markers of immature and mature oligodendrocytes, respectively. (B, D, F) Quantification of oligodendrocyte size (diameters) is shown in panels A, C, and E, respectively. Morphometric measurements of oligodendrocyte diameters were performed using ImageJ software. The results are expressed as the mean ± SEM of 3 independent experiments. *p<0.05, _t_-test.
Figure 9. Activation of the PDKI-SGKI-NDRG1-adhesion molecule pathway returns to the control level after 3 weeks recovery.
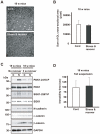
(A) Representative transverse electron micrographs of the corpus callosum of no-stress controls (18-week-old mice) (Cont) and after 3 weeks recovery after exposure to WIRS (18-week-old mice) (stress & recover). Scale bars = 10 µm. (B) Quantification of the sum of the cross-sectional areas of the oligodendrocytes is shown in panel A. Morphometric measurements were made using ImageJ software. The results are expressed as the mean ± SEM of 3 independent experiments. *p<0.05, _t_-test. (C) Western blot analysis of the corpora callosa of mice exposed to repeated WIRS (15-week-old mice) and after 3 weeks recovery (18-week-old mice). In the lysates from the corpora callosa of the mice in which repeated exposure to WIRS was discontinued, no increase in PDK1 phosphorylation, SGK1 expression or phosphorylation, or the expression of adhesion molecules such as β-catenin was identified. (D) Effects of a chronic stress, i.e., 3-week recovery after exposure to repeated WIRS, on mouse behavior. Mice in which repeated exposure to WIRS (18-week-old mice) was discontinued show no significant difference in the tail-suspension test compared to the control mice (18-week-old mice). The results are expressed as the mean ± SEM of 3 independent experiments. *p<0.05, _t_-test.
Similar articles
- Sgk1 regulates desmoglein 1 expression levels in oligodendrocytes in the mouse corpus callosum after chronic stress exposure.
Miyata S, Yoshikawa K, Taniguchi M, Ishikawa T, Tanaka T, Shimizu S, Tohyama M. Miyata S, et al. Biochem Biophys Res Commun. 2015 Aug 14;464(1):76-82. doi: 10.1016/j.bbrc.2015.05.109. Epub 2015 Jun 1. Biochem Biophys Res Commun. 2015. PMID: 26043694 - Dynamic glucocorticoid-dependent regulation of Sgk1 expression in oligodendrocytes of adult male rat brain by acute stress and time of day.
Hinds LR, Chun LE, Woodruff ER, Christensen JA, Hartsock MJ, Spencer RL. Hinds LR, et al. PLoS One. 2017 Apr 4;12(4):e0175075. doi: 10.1371/journal.pone.0175075. eCollection 2017. PLoS One. 2017. PMID: 28376115 Free PMC article. - Ethanol regulation of serum glucocorticoid kinase 1 expression in DBA2/J mouse prefrontal cortex.
Costin BN, Dever SM, Miles MF. Costin BN, et al. PLoS One. 2013 Aug 22;8(8):e72979. doi: 10.1371/journal.pone.0072979. eCollection 2013. PLoS One. 2013. PMID: 23991167 Free PMC article. - Yokukansan normalizes glucocorticoid receptor protein expression in oligodendrocytes of the corpus callosum by regulating microRNA-124a expression after stress exposure.
Shimizu S, Tanaka T, Tohyama M, Miyata S. Shimizu S, et al. Brain Res Bull. 2015 May;114:49-55. doi: 10.1016/j.brainresbull.2015.03.007. Epub 2015 Apr 7. Brain Res Bull. 2015. PMID: 25857947 - Disturbance of oligodendrocyte function plays a key role in the pathogenesis of schizophrenia and major depressive disorder.
Miyata S, Hattori T, Shimizu S, Ito A, Tohyama M. Miyata S, et al. Biomed Res Int. 2015;2015:492367. doi: 10.1155/2015/492367. Epub 2015 Feb 1. Biomed Res Int. 2015. PMID: 25705664 Free PMC article. Review.
Cited by
- Intracellular spatial transcriptomic analysis toolkit (InSTAnT).
Kumar A, Schrader AW, Aggarwal B, Boroojeny AE, Asadian M, Lee J, Song YJ, Zhao SD, Han HS, Sinha S. Kumar A, et al. Nat Commun. 2024 Sep 6;15(1):7794. doi: 10.1038/s41467-024-49457-w. Nat Commun. 2024. PMID: 39242579 Free PMC article. - Single-Cell RNA-Seq Uncovers a Robust Transcriptional Response to Morphine by Glia.
Avey D, Sankararaman S, Yim AKY, Barve R, Milbrandt J, Mitra RD. Avey D, et al. Cell Rep. 2018 Sep 25;24(13):3619-3629.e4. doi: 10.1016/j.celrep.2018.08.080. Cell Rep. 2018. PMID: 30257220 Free PMC article. - Nervous NDRGs: the N-myc downstream-regulated gene family in the central and peripheral nervous system.
Schonkeren SL, Massen M, van der Horst R, Koch A, Vaes N, Melotte V. Schonkeren SL, et al. Neurogenetics. 2019 Oct;20(4):173-186. doi: 10.1007/s10048-019-00587-0. Epub 2019 Sep 4. Neurogenetics. 2019. PMID: 31485792 Free PMC article. Review. - The activity of organic anion transporter-3: Role of dexamethasone.
Wang H, Liu C, You G. Wang H, et al. J Pharmacol Sci. 2018 Feb;136(2):79-85. doi: 10.1016/j.jphs.2017.12.011. Epub 2018 Feb 2. J Pharmacol Sci. 2018. PMID: 29422382 Free PMC article. - Quantitative Brain MRI in Congenital Adrenal Hyperplasia: In Vivo Assessment of the Cognitive and Structural Impact of Steroid Hormones.
Webb EA, Elliott L, Carlin D, Wilson M, Hall K, Netherton J, Reed J, Barrett TG, Salwani V, Clayden JD, Arlt W, Krone N, Peet AC, Wood AG. Webb EA, et al. J Clin Endocrinol Metab. 2018 Apr 1;103(4):1330-1341. doi: 10.1210/jc.2017-01481. J Clin Endocrinol Metab. 2018. PMID: 29165577 Free PMC article.
References
- Bartanusz V, Jezova D, Bertini LT, Tilders FJ, Aubry JM, et al. Stress-induced increase in vasopressin and corticotropin-releasing factor expression in hypophysiotrophic paraventricular neurons. Endocrinology. 1993;132:895–902. - PubMed
- Kendler KS, Karkowski LM, Prescott CA. Causal relationship between stressful life events and the onset of major depression. Am J Psychiatry. 1999;156:837–41. - PubMed
- Aguilera G, Rabadan-Diehl C. Vasopressinergic regulation of the hypothalamic-pituitary- adrenal axis: Implications for stress adaptation. Regul Pept. 2000;96:23–29. - PubMed
- Gold PW, Charney DS. Diseases of the mind and brain: depression: a disease of the mind, brain, and body. Am J Psychiatry. 2002;159:1826. - PubMed
- McEwen BS. Protection and damage from acute and chronic stress: allostasis and allostatic overload and relevance to the pathophysiology of psychiatric disorders. Ann NY Acad Sci. 2004;1032:1–7. - PubMed
Publication types
MeSH terms
Substances
LinkOut - more resources
Full Text Sources
Molecular Biology Databases
Research Materials
Miscellaneous
