Circulating tumor cells from patients with advanced prostate and breast cancer display both epithelial and mesenchymal markers - PubMed (original) (raw)
Circulating tumor cells from patients with advanced prostate and breast cancer display both epithelial and mesenchymal markers
Andrew J Armstrong et al. Mol Cancer Res. 2011 Aug.
Abstract
During cancer progression, malignant cells undergo epithelial-mesenchymal transitions (EMT) and mesenchymal-epithelial transitions (MET) as part of a broad invasion and metastasis program. We previously observed MET events among lung metastases in a preclinical model of prostate adenocarcinoma that suggested a relationship between epithelial plasticity and metastatic spread. We thus sought to translate these findings into clinical evidence by examining the existence of EMT in circulating tumor cells (CTC) from patients with progressive metastatic solid tumors, with a focus on men with castration-resistant prostate cancer (CRPC) and women with metastatic breast cancer. We showed that the majority (> 80%) of these CTCs in patients with metastatic CRPC coexpress epithelial proteins such as epithelial cell adhesion molecule (EpCAM), cytokeratins (CK), and E-cadherin, with mesenchymal proteins including vimentin, N-cadherin and O-cadherin, and the stem cell marker CD133. Equally, we found that more than 75% of CTCs from women with metastatic breast cancer coexpress CK, vimentin, and N-cadherin. The existence and high frequency of these CTCs coexpressing epithelial, mesenchymal, and stem cell markers in patients with progressive metastases has important implications for the application and interpretation of approved methods to detect CTCs.
Conflict of interest statement
Disclosure of Potential Conflicts of Interest: Drs. Armstrong, Oltean, George, and Garcia-Blanco are listed as inventors in a related patent application (Application Number PCT/US10/50233) filed on September 24, 2010.
Figures
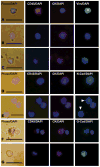
Figure 1. Co-expression of epithelial and mesenchymal proteins in CTCs from men with metastatic castration resistant prostate cancer (mCRPC)
All panels represent merged images derived from phase/DAPI, CD45/DAPI, CK/DAPI, and either vimentin(Vim)/DAPI, N-cadherin(N-cad)/DAPI expression, or O-cadherin(O-cad)/DAPI as indicated. Shown are examples of (A) a leukocyte with CD45 expression, (B) a CTC with no vimentin expression, (C) a CTC with vimentin expression, (D) a CTC with N-cadherin expression, (E) three CTCs, two with N-cadherin expression (arrowheads), (F) a CTC with O-cadherin expression and a nearby leukocyte, and (G) an additional CTC with O-cadherin expression. Scale bars represent 20 μm and were added from an image taken at identical magnification and resolution. Control cells were assayed in parallel at the same time of CTC collection and analysis with each set of patient samples and are shown in Supplementary Fig. 1.
Figure 2. Expression of vimentin and cytokeratin in prostate cancer metastases
Images are taken from a CT-guided targeted bone metastasis biopsy at the same time as circulating tumor cells were collected and evaluated for vimentin co-expression by immunofluorescence as described. Images are from patient 6 (top) and patient 7 (bottom), with CK (left) and vimentin (right) expression assayed by immunohistochemistry (20X magnification). Scale bars in the CK panels represent 50 μm and were added from an image taken at identical magnification and resolution.
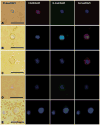
Figure 3. E-cadherin and N-cadherin co-expression among CD45 negative nucleated cells from men with metastatic CRPC
All panels represent merged images derived from phase/DAPI, CD45/DAPI, E-cadherin(E-cad)/DAPI, and N-cadherin(N-cad)/DAPI expression as indicated. (A) a leukocyte with CD45 expression, (B) a CD45 negative nucleated cell, with E-cadherin and N-cadherin co-expression, (C) a CD45 negative nucleated cell with N-cadherin expression and no E-cadherin expression, (D) a CD45 negative nucleated cell with E-cadherin expression and no N-cadherin expression, and (E) a nucleated cell lacking expression of CD45, E-cadherin, and N-cadherin. Scale bars represent 20 μm and were added from an image taken at identical magnification and resolution. Control cells were assayed in parallel at the same time of CTC collection and analysis with each set of patient samples and are shown in Supplementary Figure 1.
Figure 4. Expression of a stem-like cell marker CD133 in CTCs from men with mCRPC
All panels represent merged images derived from phase/DAPI, CD45/DAPI, CK/DAPI, and CD133/DAPI expression as indicated. Shown are examples of (A) a leukocyte with CD45 expression, (B) a CD133 negative CTC, (C) a CD133 positive CTC, and (D) an additional example of a CD133 positive CTC. Scale bars represent 20 μm and were added from an image taken at identical magnification and resolution. Control cells were assayed in parallel at the same time of CTC collection and analysis with each set of patient samples and are shown in Supplementary Figure 1.
Similar articles
- Epithelial to mesenchymal transition markers expressed in circulating tumour cells of early and metastatic breast cancer patients.
Kallergi G, Papadaki MA, Politaki E, Mavroudis D, Georgoulias V, Agelaki S. Kallergi G, et al. Breast Cancer Res. 2011 Jun 10;13(3):R59. doi: 10.1186/bcr2896. Breast Cancer Res. 2011. PMID: 21663619 Free PMC article. - Epithelial-mesenchymal transition and stemness features in circulating tumor cells from breast cancer patients.
Raimondi C, Gradilone A, Naso G, Vincenzi B, Petracca A, Nicolazzo C, Palazzo A, Saltarelli R, Spremberg F, Cortesi E, Gazzaniga P. Raimondi C, et al. Breast Cancer Res Treat. 2011 Nov;130(2):449-55. doi: 10.1007/s10549-011-1373-x. Epub 2011 Feb 5. Breast Cancer Res Treat. 2011. PMID: 21298334 - Epithelial-to-mesenchymal transition leads to disease-stage differences in circulating tumor cell detection and metastasis in pre-clinical models of prostate cancer.
Lowes LE, Goodale D, Xia Y, Postenka C, Piaseczny MM, Paczkowski F, Allan AL. Lowes LE, et al. Oncotarget. 2016 Nov 15;7(46):76125-76139. doi: 10.18632/oncotarget.12682. Oncotarget. 2016. PMID: 27764810 Free PMC article. - Expression of stem cell and epithelial-mesenchymal transition markers in circulating tumor cells of breast cancer patients.
Krawczyk N, Meier-Stiegen F, Banys M, Neubauer H, Ruckhaeberle E, Fehm T. Krawczyk N, et al. Biomed Res Int. 2014;2014:415721. doi: 10.1155/2014/415721. Epub 2014 May 8. Biomed Res Int. 2014. PMID: 24895575 Free PMC article. Review. - Mesenchymal-Epithelial Transition and Circulating Tumor Cells in Small Cell Lung Cancer.
Hamilton G, Rath B. Hamilton G, et al. Adv Exp Med Biol. 2017;994:229-245. doi: 10.1007/978-3-319-55947-6_12. Adv Exp Med Biol. 2017. PMID: 28560677 Review.
Cited by
- Preclinical and Clinical Evaluation of Magnetic-Activated Cell Separation Technology for CTC Isolation in Breast Cancer.
Lozar T, Jesenko T, Kloboves Prevodnik V, Cemazar M, Hosta V, Jericevic A, Nolde N, Grasic Kuhar C. Lozar T, et al. Front Oncol. 2020 Sep 15;10:554554. doi: 10.3389/fonc.2020.554554. eCollection 2020. Front Oncol. 2020. PMID: 33042837 Free PMC article. - Nanoresonator chip-based RNA sensor strategy for detection of circulating tumor cells: response using PCA3 as a prostate cancer marker.
Sioss JA, Bhiladvala RB, Pan W, Li M, Patrick S, Xin P, Dean SL, Keating CD, Mayer TS, Clawson GA. Sioss JA, et al. Nanomedicine. 2012 Aug;8(6):1017-25. doi: 10.1016/j.nano.2011.11.009. Epub 2011 Nov 22. Nanomedicine. 2012. PMID: 22115599 Free PMC article. - Contacts with Macrophages Promote an Aggressive Nanomechanical Phenotype of Circulating Tumor Cells in Prostate Cancer.
Osmulski PA, Cunsolo A, Chen M, Qian Y, Lin CL, Hung CN, Mahalingam D, Kirma NB, Chen CL, Taverna JA, Liss MA, Thompson IM, Huang TH, Gaczynska ME. Osmulski PA, et al. Cancer Res. 2021 Aug 1;81(15):4110-4123. doi: 10.1158/0008-5472.CAN-20-3595. Epub 2021 May 27. Cancer Res. 2021. PMID: 34045187 Free PMC article. - Liquid biopsy in lung cancer management.
Irofei Zamfir MA, Buburuzan L, Hudiţă A, Gălăţeanu B, Ginghină O, Ion D, Motaş N, Ardeleanu CM, Costache M. Irofei Zamfir MA, et al. Rom J Morphol Embryol. 2022 Jan-Mar;63(1):31-38. doi: 10.47162/RJME.63.1.02. Rom J Morphol Embryol. 2022. PMID: 36074665 Free PMC article. - Postoperative detection of circulating tumor cells predicts tumor recurrence in colorectal cancer patients.
Galizia G, Gemei M, Orditura M, Romano C, Zamboli A, Castellano P, Mabilia A, Auricchio A, De Vita F, Del Vecchio L, Lieto E. Galizia G, et al. J Gastrointest Surg. 2013 Oct;17(10):1809-18. doi: 10.1007/s11605-013-2258-6. Epub 2013 Jun 28. J Gastrointest Surg. 2013. PMID: 23813048
References
- Hay ED, Zuk A. Transformations between epithelium and mesenchyme: normal, pathological, and experimentally induced. Am J Kidney Dis. 1995;26:678–90. - PubMed
- Blick T, Widodo E, Hugo H, et al. Epithelial mesenchymal transition traits in human breast cancer cell lines. Clin Exp Metastasis. 2008;25:629–42. - PubMed
Publication types
MeSH terms
Substances
Grants and funding
- R01 CA127727-03/CA/NCI NIH HHS/United States
- F32 CA142095/CA/NCI NIH HHS/United States
- T32 CA059365/CA/NCI NIH HHS/United States
- R01 GM63090/GM/NIGMS NIH HHS/United States
- K12 CA100639/CA/NCI NIH HHS/United States
- R01 CA127727-01A2/CA/NCI NIH HHS/United States
- R01 GM063090-07/GM/NIGMS NIH HHS/United States
- R01 CA127727/CA/NCI NIH HHS/United States
- 5K12-CA-100639-05/CA/NCI NIH HHS/United States
- R01 GM063090/GM/NIGMS NIH HHS/United States
LinkOut - more resources
Full Text Sources
Other Literature Sources
Medical
Research Materials
Miscellaneous


