Tumor-initiating stem cells of squamous cell carcinomas and their control by TGF-β and integrin/focal adhesion kinase (FAK) signaling - PubMed (original) (raw)
Tumor-initiating stem cells of squamous cell carcinomas and their control by TGF-β and integrin/focal adhesion kinase (FAK) signaling
Markus Schober et al. Proc Natl Acad Sci U S A. 2011.
Abstract
Cancer stem cells (CSCs) sustain tumor growth through their ability to self-renew and to generate differentiated progeny. These functions endow CSCs with the potential to initiate secondary tumors bearing characteristics similar to those of the parent. Recently the hair follicle stem cell marker CD34 was used to purify a CSC-like cell population from early skin tumors arising from treatment with 7,12-dimethylbenz[α]anthracene/12-o-tetradecanoylphorbol-13-acetate, which typically generates benign papillomas that occasionally progress to squamous cell carcinomas (SCCs). In the present study, we identify and characterize CSCs purified from malignant SCCs. We show that SCCs contain two highly tumorigenic CSC populations that differ in CD34 levels but are enriched for integrins and coexist at the SCC-stroma interface. Intriguingly, whether CD34(lo) or CD34(hi), α6(hi)β1(hi) populations can initiate secondary tumors by serial limit-dilution transplantation assays, but α6(lo)β1(lo) populations cannot. Moreover, secondary tumors generated from a single CSC of either subtype contain both CD34(lo) and CD34(hi) α6(hi)β1(hi)CSCs, indicating their nonhierarchical organization. Genomic profiling and hierarchical cluster analysis show that these two CSC subtypes share a molecular signature distinct from either the CD34(-) epidermal or the CD34(hi) hair follicle stem cell signature. Although closely related, α6(hi)β1(hi)CD34(lo) and α6(hi)β1(hi)CD34(hi) CSCs differ in cell-cycle gene expression and proliferation characteristics. Indeed, proliferation and expansion of α6(hi)β1(hi)CD34(hi) CSCs is sensitive to whether they can initiate a TGF-β receptor II-mediated response to counterbalance elevated focal adhesion kinase-mediated integrin signaling within the tumor. Overall, the coexistence and interconvertibility of CSCs with differing sensitivities to their microenvironment pose challenges and opportunities for SCC cancer therapies.
Conflict of interest statement
The authors declare no conflict of interest.
Figures
Fig. 1.
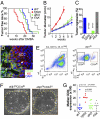
TβRII and FAK interact to control tumor initiation and growth and influence SCC composition. (A) Kaplan–Meier curves describing tumor-free survival after DMBA treatments of wild-type (blue), TβRIIKO (red), dKO (green), and FAKKO (gray) mice (P < 0.0001, Mantel–Cox log-rank test). Wild-type and _dKO_ mice exhibit indistinguishable profiles (_P_ = 0.271). Differences between _TβRIIKO_ and _dKO_ (_P_ = 0.0004, Mantel–Cox log-rank test) and _FAKKO_ and _dKO_ (_P_ = 0.0165, Mantel–Cox log-rank test) are statistically significant. (_B_) Tumor growth after initiation. _TβRIIKO_ grow faster than other genotypes (_n_ > 10; error bars indicate SEM). (C) Tumor regression after initiation depends upon TβRII function. (D) In SCCs, K5 is expressed in the undifferentiated cells at the tumor–stroma interface. Some K5+ cells express CD34. Although many CD34+ cells are in direct contact with the stroma, CD34+ cells also can be found at a distance from the tumor–stroma interface (arrow). (E) Representative flow cytometry profiles of cells isolated from primary SCCs and fractionated based on surface α6 (CD49f) and β1 (CD29) integrins after selecting live cells and eliminating CD11b+, CD45+, and CD31+ stromal cells. Both CD34lo and CD34hi α6β1hi cells (subfractionated into populations as in F) yielded large keratinocyte colonies (delineated by yellow dotted lines in representative phase contrast images) that could be passaged over the long term on fibroblast feeders. (G) Median CD34 expression in wild-type, TβRIIKO, dKO, and FAKKO SCCs reveals that the CD34hi population is expanded in TβRIIKO SCCs in a FAK-dependent manner. The means of median CD34 levels in the four SCC populations differ significantly (P = 0.02, ANOVA).
Fig. 2.
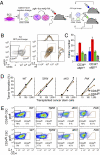
Cutaneous SCCs contain two interchangeable populations of CSCs that have tumor-initiating potential and are regulated by TβRII/TGF-β and FAK/integrin signaling. (A) Strategy to isolate CSCs. FACS-purified CD34hiCD29hiCD49fhiCD45−CD31−CD11b− cells are tagged with an RFP fluorescent reporter, and their long-term tumor-initiating potential is tested by serial orthotopic grafting experiments in immune-compromised Nude mice. (B) Representative flow cytometry profiles of RFP+ live cells isolated from secondary SCCs and separated based on their CD34 expression. Contour plots illustrate CD34lo (black) and CD34hi (brown) populations, which then were fractionated further based on α6(CD49f) and β1(CD29) integrin expression. Overlays illustrate that CD34hi subpopulations are either α6hiβ1hi or α6loβ1lo. (C and D) Colony formation (wild type, blue; _TβRIIKO_’ red; dKO,; green; FAKKO, gray; n > 2; error bars indicate SEM) and limit-dilution orthotopic transplantation experiments (n = 15–42 per data point; 576 grafts total) indicate that both α6β1hiCD34lo and α6β1hiCD34hi SCC cells form colonies in culture and tertiary SCCs in vivo, but their abilities depend upon TβRII and FAK function. (E) Flow cytometry profiles of tertiary SCCs illustrating the potential of CD34hi and CD34lo CSCs to generate CD34hi and CD34lo progeny interchangeably.
Fig. 3.
Tumor-initiation potential upon transplantation of single SCC CSCs. (A) Kaplan–Meier curve describing tumor-initiation frequency over time after transplantation of single CD34loα6hiβ1hi and CD34hiα6hiβ1hi cells into Nude mice. (n = 12, P = 0.185, Mantel–Cox log-rank test.) (B) Growth kinetics of tumors growing after transplantation of single CSCs. Although rates are variable, CD34loα6hiβ1hi CSCs have a tendency to initiate growth more rapidly than CD34hiα6hiβ1hi CSCs. (C) Flow cytometry profiles of tertiary SCCs. Note that single CD34hi and CD34lo CSCs have the potential to generate CD34hi and CD34lo progeny interchangeably within the tumors that they generate.
Fig. 4.
Defining a cancer stem cell signature for SCCs. (A) Hierarchical cluster analysis of Affymetrix 430 2.0 array data indicates that, whether CD34+ or CD34−, SCC CSCs are more similar to each other than they are to wild-type SCs from either epidermis or HFs. Note that core markers of CD34+ HF-SCs, including Nfatc1, Lhx2, vitamin D receptor (VdR), and Lgr5, are strikingly reduced or absent in CSCs. Other adult SC markers [Lrig1, PR domain containing 1, with ZNF domain (Prdm1), and _Sox9_] are not uniformly elevated in CSCs. (B) Differential expression analyses indicate key distinctions between CSCs and wild-type SCs. Shown are fold changes (log2 scale) of previously described HF-SC markers between α6β1hiCD34hi and α6β1hiCD34lo cells of wild-type, TβRIIKO, dKO, and FAKKO SCCs and wild-type skin epithelium. Note that HF-SC marker genes other than CD34 are not differentially expressed in these two CSC populations. Bars indicate the average of two independent experiments. HF-SCs (α6hiβ1hiCD34hi) vs. epidermis (α6hiβ1hiCD34neg) serves as a positive control. (C) Venn diagram revealing a core CSC signature of 742 genes that are up-regulated by twofold or more (P < 0.05) in all CSCs irrespective of their genotype and whether compared with wild-type HF-SCs or epidermal progenitors. Functional hierarchical cluster analysis indicates enrichment for processes that are commonly deregulated in cancers. (D) Selected sets of skin genes that are elevated (red) or abrogated (blue) by more than twofold in CSCs compared with wild-type-SCs. (E_–_K) Immunofluorescence microscopy (E_–_I) and immunoblot analyses (K) validate the CSC signature and define the CSC niche at the tumor–stroma interface. Validation was performed on independent primary SCCs that developed in wild-type mice. (Scale bars: 20 μm.) FACS analysis in J shows that surface marker CD44, up-regulated in CSCs and localized at the tumor–stroma interface (I), is in the integrin-high population.
Fig. 5.
TGF-β/FAK signaling-dependent differences in proliferative activities of α6β1hiCD34hi CSCs. (A) Differential expression and functional hierarchical cluster analysis of α6β1hiCD34hi CSCs. Note that fast-cycling (TβRIIKO) α6β1hiCD34hi CSCs are enriched for cell-cycle and DNA repair transcripts, whereas slow-cycling (dKO, FAKKO) α6β1hiCD34hi CSCs display elevated transcripts for ECM, morphogenesis, migration, and antiapoptosis pathways. (B) Flow cytometry data indicate that EdU (6-h pulse) incorporates predominantly in CD34lo and not in CD34hi CSCs, unless TβRII is compromised and FAK function is sustained. Bar graphs indicate relative abundance of EdU+ cells in α6β1hiCD34hi CSCs over EdU+ cells in α6β1hiCD34lo CSCs. Note that loss of Tgfβ signaling in the presence of elevated FAK signaling leads to a specific enrichment in the proliferative activity within the α6β1hiCD34hi CSCs. (n > 5; P < 0.0001, ANOVA; error bars indicate SEM.) (C) Working model in which CSCs exist in interchangeable α6β1hiCD34hi and α6β1hiCD34lo states. Activated β1 integrin and its ligand fibronectin (FN1) promote self-renewal of both CSCs, whereas active TGF-β/TβRII signaling primarily influences α6β1hiCD34hi CSCs, restricting their self-renewal and expansion.
Similar articles
- Cancer stem-like cells enriched with CD29 and CD44 markers exhibit molecular characteristics with epithelial-mesenchymal transition in squamous cell carcinoma.
Geng S, Guo Y, Wang Q, Li L, Wang J. Geng S, et al. Arch Dermatol Res. 2013 Jan;305(1):35-47. doi: 10.1007/s00403-012-1260-2. Epub 2012 Jun 28. Arch Dermatol Res. 2013. PMID: 22740085 - Cancer stem cells and their niche in the progression of squamous cell carcinoma.
Oshimori N. Oshimori N. Cancer Sci. 2020 Nov;111(11):3985-3992. doi: 10.1111/cas.14639. Epub 2020 Sep 18. Cancer Sci. 2020. PMID: 32888236 Free PMC article. Review. - Therapeutic targeting of the focal adhesion complex prevents oncogenic TGF-beta signaling and metastasis.
Wendt MK, Schiemann WP. Wendt MK, et al. Breast Cancer Res. 2009;11(5):R68. doi: 10.1186/bcr2360. Breast Cancer Res. 2009. PMID: 19740433 Free PMC article. - SOX2 controls tumour initiation and cancer stem-cell functions in squamous-cell carcinoma.
Boumahdi S, Driessens G, Lapouge G, Rorive S, Nassar D, Le Mercier M, Delatte B, Caauwe A, Lenglez S, Nkusi E, Brohée S, Salmon I, Dubois C, del Marmol V, Fuks F, Beck B, Blanpain C. Boumahdi S, et al. Nature. 2014 Jul 10;511(7508):246-50. doi: 10.1038/nature13305. Epub 2014 Jun 8. Nature. 2014. PMID: 24909994 - Cancer Stem Cells in Squamous Cell Carcinoma.
Jian Z, Strait A, Jimeno A, Wang XJ. Jian Z, et al. J Invest Dermatol. 2017 Jan;137(1):31-37. doi: 10.1016/j.jid.2016.07.033. Epub 2016 Nov 24. J Invest Dermatol. 2017. PMID: 27638386 Free PMC article. Review.
Cited by
- TGF-β promotes heterogeneity and drug resistance in squamous cell carcinoma.
Oshimori N, Oristian D, Fuchs E. Oshimori N, et al. Cell. 2015 Feb 26;160(5):963-976. doi: 10.1016/j.cell.2015.01.043. Cell. 2015. PMID: 25723170 Free PMC article. - TGF-β family signaling in stem cells.
Sakaki-Yumoto M, Katsuno Y, Derynck R. Sakaki-Yumoto M, et al. Biochim Biophys Acta. 2013 Feb;1830(2):2280-96. doi: 10.1016/j.bbagen.2012.08.008. Epub 2012 Aug 16. Biochim Biophys Acta. 2013. PMID: 22959078 Free PMC article. Review. - Anti-Cancer Stem-like Cell Compounds in Clinical Development - An Overview and Critical Appraisal.
Marcucci F, Rumio C, Lefoulon F. Marcucci F, et al. Front Oncol. 2016 May 10;6:115. doi: 10.3389/fonc.2016.00115. eCollection 2016. Front Oncol. 2016. PMID: 27242955 Free PMC article. Review. - Nanog increases focal adhesion kinase (FAK) promoter activity and expression and directly binds to FAK protein to be phosphorylated.
Ho B, Olson G, Figel S, Gelman I, Cance WG, Golubovskaya VM. Ho B, et al. J Biol Chem. 2012 May 25;287(22):18656-73. doi: 10.1074/jbc.M111.322883. Epub 2012 Apr 5. J Biol Chem. 2012. PMID: 22493428 Free PMC article. - A family business: stem cell progeny join the niche to regulate homeostasis.
Hsu YC, Fuchs E. Hsu YC, et al. Nat Rev Mol Cell Biol. 2012 Jan 23;13(2):103-14. doi: 10.1038/nrm3272. Nat Rev Mol Cell Biol. 2012. PMID: 22266760 Free PMC article. Review.
References
- Hanahan D, Weinberg RA. The hallmarks of cancer. Cell. 2000;100:57–70. - PubMed
- He S, Nakada D, Morrison SJ. Mechanisms of stem cell self-renewal. Annu Rev Cell Dev Biol. 2009;25:377–406. - PubMed
- Clarke MF, et al. Cancer stem cells—perspectives on current status and future directions: AACR Workshop on cancer stem cells. Cancer Res. 2006;66:9339–9344. - PubMed
- Clevers H. The cancer stem cell: Premises, promises and challenges. Nat Med. 2011;17:313–319. - PubMed
Publication types
MeSH terms
Substances
Grants and funding
- R37 AR027883/AR/NIAMS NIH HHS/United States
- HHMI/Howard Hughes Medical Institute/United States
- R00 AR057260/AR/NIAMS NIH HHS/United States
- 5K99-AR057260-02/AR/NIAMS NIH HHS/United States
- R01 AR027883/AR/NIAMS NIH HHS/United States
- R01-AR27883/AR/NIAMS NIH HHS/United States
- K99 AR057260/AR/NIAMS NIH HHS/United States
LinkOut - more resources
Full Text Sources
Other Literature Sources
Medical
Molecular Biology Databases
Research Materials
Miscellaneous


