Upregulation of CREB-mediated transcription enhances both short- and long-term memory - PubMed (original) (raw)
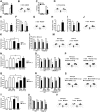
Figure 1.
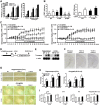
Generation of CREB-Y134F expression mice. A, Activation of CREB-mediated transcription by the upstream signal transduction pathway in PC12 cells. B, CREB–CBP (KIX) complex formation in COS-1 cells in the acceptor bleaching test. We analyzed 34–54 cells in each group. a_p_ < 0.05, compared with the other groups; b_p_ < 0.05, compared with the other groups. C, Real-time imaging of CREB–CBP (KIX) complex formation in response to the activation of the PKA signaling pathway in PC12 cells. Emission ratios were measured before and after the application of FSK (0.1 or 1 μ
m
). We analyzed 32–39 cells in each group. In the presence of 0.1 μ
m
FSK, repeated ANOVA revealed significant effects of time, mutation (WT vs Y134F) and time versus mutation interaction (time, F(19,1254) = 29.050, p < 0.05; mutation, F(1,66) = 7.920, p < 0.05; interaction, F(19,1254) = 2.721, p < 0.05). In contrast, in the presence of 1 μ
m
FSK, repeated ANOVA revealed a significant effect of time, but not effects of mutation and time vs mutation interaction (time, F(19,1406) = 52.206, p < 0.05; mutation, _F_(1,74) = 0.283, _p_ > 0.05; interaction, F(19,1406) = 0.503, p > 0.05). D, Schematic representation of the CREB-Y134F transgenic construct. E, Northern blot analysis of the transgene in the hippocampus and cortex of WT, Y134F-A (A), and Y134F-C (C) mice. The SV40 poly(A) probe detected transgenic mRNA of 2.5 kb. F, In situ hybridization analyses of transgene mRNA expression in Y134F-A, Y134F-C, and WT mice. The SV40 poly(A) probe detected transgene mRNA in the forebrain of Y134F-A and Y134F-C mice. Scale bar, 500 μm. G, Immunohistochemical analyses of c-fos expression after fear conditioning. Scale bar, 100 μm. H, Quantification of the number of c-_fos_-positive cells after contextual fear conditioning in WT, Y134F-A, and Y134F-C mice. The conditioning group consisted of WT (n = 8), A (n = 8), and C (n = 8); the no-conditioning group consisted of WT (n = 8), A (n = 9), and C (n = 10). I, Quantification of the number of c-_fos_-positive cells at the basal condition. One-way ANOVA followed by the post hoc Newman–Keuls test showed significantly higher expression levels of c-fos in the CA1 (p < 0.05) but not the CA3 or dentate gyrus (DG) areas of the hippocampus in Y134F-A and -C mice compared with WT mice. Similarly, Y134F-C mice showed significantly higher expression levels of c-fos in the amygdala compared with WT mice (p < 0.05). Y134F-C mice displayed higher expression levels of c-fos in the hippocampal CA1 and amygdala compared with Y134F-A mice, although this difference was not significant. WT mice, n = 11; Y134F-A mice, n = 11; Y134F-C mice, n = 10. Error bars represent SEM. *p < 0.05. BLA, Basolateral amygdala; LA, lateral amygdala.
Figure 2.
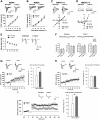
Enhanced LTP in the hippocampal CA1 neurons of CREB-Y134F mice. A, Input–output relationship of the AMPA receptor-mediated EPSCs. B, Input–output relationship of the NMDA receptor-mediated EPSCs. C, Current–voltage relationship of EPSCs mediated by the AMPA receptor. D, Current–voltage relationship of EPSCs mediated by the NMDA receptor. E, Paired-pulse facilitation. F, Miniature EPSCs in the presence of 1 μ
m
tetrodotoxin. G, H, LTP was induced by three presynaptic stimuli that caused three EPSPs (10 ms ahead) with three postsynaptic APs at 30 Hz, paired 15 times every 5 s (EPSP–AP protocol). The insets show averages of six EPSCs at baseline response (a) and 25–30 min after induction of LTP (b). Normalized EPSC amplitudes at 25–30 min after LTP induction (bar graph) are shown. G, Y134F-C. H, Y134F-A. I, L-LTP induced by high-frequency stimulation [4 × 100 Hz, 1 s trains at 5 min intervals] in hippocampal slices. Inset, representative fEPSP traces before and 180 min after stimulation. Normalized fEPSC amplitudes at 0–180 min after LTP induction (bar graph) are shown. WT, n = 5–8 (A–I); A, n = 7 (H); C, n = 5–8 (A–G, I). Error bars represent SEM. *p < 0.05.
Figure 3.
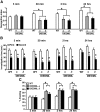
Expression of CREB-Y134F enhances memory formation. A, B, Social recognition test. A, Recognition index. *p < 0.05. **_B_**, Investigation time. Thirty minutes or 2 h after the first exposure, WT and Y134F mice showed a significant reduction in investigation time (a paired _t_ test, _p_ < 0.05). In contrast, at 24 h after the first exposure, Y134F, but not WT, mice showed a significant reduction in investigation time (WT, _p_ > 0.05; A and C, p < 0.05). *p < 0.05, compared with the first exposure. Data show 30 min STM (WT, n = 13; A, n = 14; C, n = 13), 2 h STM (WT, n = 25; A, n = 11; C, n = 11), and 24 h LTM (WT, n = 24; A, n = 8; C, n = 12). C, Contextual fear-conditioning test. Data show 30 min STM (WT, n = 22; A, n = 12; C, n = 15), 2 h STM (WT, n = 18; A, n = 11; C, n = 14), and 24 h LTM (WT, n = 44; A, n = 17; C, n = 20). *p < 0.05. D, Contextual discrimination test. Data show 1 d (WT-CXT-S, n = 10; WT-CXT-D, n = 11; Y134F-C-CXT-S, n = 13; Y134F-C-CXT-D, n = 12) or 1 month (WT-CXT-S, n = 18; WT-CXT-D, n = 10; Y134F-C-CXT-S, n = 17; Y134F-C-CXT-D, n = 12) totals. *p < 0.05. E–G, Morris water maze test. WT, n = 22; A, n = 12; C, n = 17. *p < 0.05, compared with the other three quadrants (a paired t test); #p < 0.05. H, Passive avoidance test. Data show 2 h (WT, n = 13; C, n = 13) and 24 h (WT, n = 14; C, n = 12) totals. *p < 0.05. Error bars represent SEM.
Figure 4.
Generation of CREB-DIEDML expression mice. A, Activation of CREB-mediated transcription in PC12 cells. Luc., luciferase. B, CREB–CBP (KIX) complex formation in COS-1 cells in the acceptor bleaching test. We analyzed 52–65 cells in each group. C, Schematic representation of the CREB-DIEDML transgenic construct. D, Northern blot analysis of the transgene in the hippocampus and cortex of WT mice, DIEDML-α (α), and DIEDML-β (β) mice. The SV40 poly(A) probe detected transgenic mRNA of 2.5 kb. E, In situ hybridization analyses of transgene mRNA expression in DIEDML-α, DIEDML-β, and WT mice. The SV40 poly(A) probe detected transgene mRNA in the forebrain of DIEDML-α and -β mice. Scale bar, 500 μm. F, Levels of total CREB in the hippocampus. Active CREB mice displayed higher levels of total CREB compared with WT mice. G, Immunohistochemical analyses of c-fos expression after fear conditioning. Scale bar, 100 μm. H, Quantification of the number of c-_fos_-positive cells after contextual fear conditioning in WT, DIEDML-α, and DIEDML-β mice. Data for the conditioning group (WT, n = 7; α, n = 9; β, n = 7) and no-conditioning group (WT, n = 6; α, n = 7; β, n = 6) are shown. I, Coimmunoprecipitation (I.P.) experiments were performed using an anti-CBP antibody, and Western blot analysis was performed using anti-CREB or anti-α tubulin antibodies. The input lanes represent 10% of the total cell lysates in the binding reaction. J, Quantification of CREB level (input). Both DIEDML transgenic lines displayed significant increases in the levels of CREB in the hippocampus compared with WT mice. K, Quantification of CREB levels (I.P.). DIEDML mice displayed significantly higher levels of CREB protein in the precipitates after incubation with the anti-CBP antibody compared with WT mice. WT, n = 7; α, n = 7; β, n = 7. Error bars represent SEM. *p < 0.05.
Figure 5.
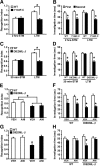
Expression of CREB-DIEDML enhances STM and LTM. A, B, Social recognition test. A, Recognition index. *p < 0.05. **_B_**, Investigation time. At 5 min, 30 min, or 2 h after the first exposure, WT and DIEDML mice showed a significant reduction in investigation time (5 min, _p_ < 0.05; 30 min, _p_ < 0.05; 2 h, _p_ < 0.05). In contrast, at 24 h after the first exposure, DIEDML but not WT mice showed a significant reduction in investigation time (WT, _p_ > 0.05; α and β, p < 0.05). These observations indicated that DIEDML mice formed 5 min, 30 min, and 2 h STM and LTM, whereas WT mice formed only STMs but not LTM. *p < 0.05, compared with the first exposure. Data are shown for 5 min (WT, n = 32; α, n = 22; β, n = 17), 30 min (WT, n = 41; α, n = 16; β, n = 17), 2 h (WT, n = 27; α, n = 14; β, n = 20), and 24 h (WT, n = 22; α, n = 15; β, n = 9). C, Contextual fear-conditioning test. Data are shown for 5 min (WT, n = 24; α, n = 8; β, n = 20), 30 min (WT, n = 33; α, n = 19; β, n = 16), 2 h (WT, n = 22; α, n = 8; β, n = 13), and 24 h (WT, n = 70; α, n = 14; β, n = 24). Error bars represent SEM. *p < 0.05.
Figure 6.
Dissociation of mechanisms for the enhancement of short-term and long-term social recognition memory in active CREB mice. A, B, Two-hour STM (WT, n = 8; C, n = 8) and 24 h LTM (WT, n = 8; C, n = 8) in Y134F-C and WT mice. C, D, Thirty-minute STM (WT, n = 8; β, n = 8) and 24 h LTM (WT, n = 8; β, n = 8) in DIEDML-β and WT mice. A, C, Recognition index. *p < 0.05. **_B_**, **_D_**, Investigation time. At 30 min (**_B_**) or 2 h (**_D_**) after the first exposure, WT and active CREB mutant mice showed a significant reduction in investigation time (_p_ < 0.05). In contrast, 24 h after the first exposure (**_B_**, **_D_**), active CREB mutant but not WT mice showed a significant reduction in investigation time (WT, _p_ > 0.05; C, p < 0.05; β, _p_ < 0.05). These observations indicated that active CREB mice formed STM and LTM, whereas WT mice formed only STM but not LTM. *_p_ < 0.05, compared with the first exposure. **_E_**, **_F_**, Effect of protein synthesis inhibition on 2 h STM in DIEDML-β and WT mice (WT-VEH, _n_ = 8; WT-ANI, _n_ = 9; β-VEH, _n_ = 10; β-ANI, _n_ = 9). **_E_**, Recognition index. *_p_ < 0.05. **_F_**, Investigation time. Two hours after the first exposure, WT and DIEDML-β mice treated with ANI or VEH showed significant reductions in investigation time (_p_ < 0.05), indicating that all groups formed STM. *_p_ < 0.05, compared with the first exposure. **_G_**, **_H_**, Effect of protein synthesis inhibition on 24 h LTM in DIEDML-β and WT mice (WT-VEH, _n_ = 11; WT-ANI, _n_ = 10; β-VEH, _n_ = 8; β-ANI, _n_ = 8). **_G_**, Recognition index. *_p_ < 0.05. **_H_**, Investigation time. Twenty-four hours after the first exposure, the β-VEH group showed a significant reduction in investigation time (_p_ < 0.05), whereas the other groups of mice did not (_p_ > 0.05), indicating that only the β-VEH group formed LTM. *p < 0.05, compared with the first exposure. Error bars represent SEM.
Figure 7.
BDNF expression levels in the hippocampus of active CREB mutant mice. Y134F-C (n = 6), DIEDML-α (n = 8), and DIEDML-β (n = 8) mice showed a higher level of BDNF expression in the hippocampus compared with WT (n = 15) and Y134F-A (n = 6) mice. Error bars represent SEM. #p < 0.05, compared with WT; *p < 0.05.
Figure 8.
Effects of the microinfusion of BDNF and K252a on STM and LTM in active CREB and WT mice. A, Effects of the microinfusion of BDNF into the dorsal hippocampus on 2 h short-term contextual fear memory in WT mice (VEH, n = 14; BDNF, n = 11). *p < 0.05, compared with the VEH group at test. **_B_**, **_D_**, **_G_**, **_J_**, **_M_**, **_P_**, **_S_**, **_V_**, Cannula tip placements from mice infused with each drug for **_A_**, **_C_**, **_E_**, **_H_**, **_K_**, **_N_**, **_Q_**, and **_T_**, respectively. Coronal sections are adapted from Paxinos and Franklin (1997) (1.94 mm posterior to bregma). **_C_**, Effects of the microinfusion of K252a into the dorsal hippocampus on 2 h short-term contextual fear memory in WT mice (VEH, _n_ = 9; K252a, _n_ = 8.). *_p_ < 0.05, compared with the VEH group at test. **_E–G_**, Effects of the microinfusion of BDNF into the dorsal hippocampus on the 2 h short-term social recognition memory in WT mice (VEH, _n_ = 8; BDNF, _n_ = 8). **_E_**, Recognition index. *_p_ < 0.05, compared with the VEH group. **_F_**, Investigation time. The VEH or BDNF group showed significant reductions in investigation time (_p_ < 0.05), indicating that both groups formed 2 h STM. *_p_ < 0.05, compared with the first exposure (left). **_H–J_**, Effects of the microinfusion of K252a into the dorsal hippocampus on the 2 h short-term social recognition memory in WT mice (VEH, _n_ = 8; K252a, _n_ = 8). **_H_**, Recognition index. *_p_ < 0.05, compared with the VEH group. **_I_**, Investigation time. The VEH, but not K252a, group showed a significant reduction in investigation time (VEH, _F_(1,14) = 17.82, _p_ < 0.05; K252a, _F_(1,14) = 0.727, _p_ > 0.05), indicating that only the VEH group formed 2 h STM. *p < 0.05, compared with the first exposure. **_K–M_**, Effects of the microinfusion of a low dose of BDNF into the dorsal hippocampus on 30 min STM in WT and Y134F-C mice (WT-VEH, _n_ = 8; WT-BDNF, _n_ = 9; C-VEH, _n_ = 9; C-BDNF, _n_ = 8). **_K_**, Recognition index. *_p_ < 0.05, compared with the other three groups. **_L_**, Investigation time. WT and Y134F-C mice treated with BDNF or VEH showed a significant reduction in investigation time (_p_ < 0.05), indicated that all groups formed STM. *_p_ < 0.05, compared with the first exposure. **_N–P_**, Effects of the microinfusion of low or high doses of K252a (3 or 9.35 ng per side) into the dorsal hippocampus on 2 h STM in WT and DIEDML-β mice (WT-VEH, _n_ = 10; WT-low, _n_ = 8; WT-high, _n_ = 8; β-VEH, _n_ = 8; β-low, _n_ = 9; β-high, _n_ = 10). **_N_**, Recognition index. #_p_ < 0.05, compared with WT-VEH; *_p_ < 0.05, compared with WT-low K252a. **_O_**, Investigation time. The WT-VEH, β-VEH, and β-low groups showed significant reductions in investigation time (_p_ < 0.05), whereas the other groups did not (_p_ > 0.05). These observations indicated that the WT-VEH, β-VEH, and β-low groups formed 2 h STM. *p < 0.05, compared with the first exposure. **_Q–S_**, Effects of the microinfusion of a low or high dose of anti-BDNF antibody (0.5 μg or 1 μg per side) into the dorsal hippocampus. A higher dose of anti-BDNF antibody is required to impair 2 h STM in DIEDML-β mice compared with WT mice (WT-VEH, _n_ = 9; WT-low, _n_ = 9; WT-high, _n_ = 8; β-VEH, _n_ = 11; β-low, _n_ = 10; β-high, _n_ = 10). **_Q_**, Recognition index. A significant interaction between genotype × drug treatment (low vs high dose of anti-BDNF antibody) was observed (_F_(1,33) = 8.594, _p_ < 0.05). The β-VEH group exhibited enhanced 2 h STM compared with the WT-VEH group (_p_ < 0.05). WT-low and -high groups displayed significantly worse recognition indices compared with the WT-VEH group (_p_ < 0.05). The β-low group displayed a comparable recognition index (_p_ > 0.05), but the β-high group displayed a significantly worse recognition index, compared with the WT-VEH group, respectively. #p < 0.05, compared with WT-VEH; *_p_ < 0.05, compared with WT-low BDNF antibody. **_R_**, Investigation times. The WT-VEH, β-VEH, and β-low groups showed a significant reduction in investigation time (_p_ < 0.05), whereas the other groups did not (_p_ > 0.05). These observations indicated that the WT-VEH, β-VEH, and β-low groups formed 2 h STM. *p < 0.05, compared with the first exposure. **_T–V_**, Effects of the microinfusion of BDNF into the dorsal hippocampus on 48 h LTM in Y134F-A and WT mice (WT-VEH, _n_ = 9; WT-BDNF, _n_ = 10; A-VEH, _n_ = 9; A-BDNF, _n_ = 11). **_T_**, Recognition index. *_p_ < 0.05, compared with the other three groups. **_U_**, Investigation time. The WT-BDNF and A-BDNF groups (_p_ < 0.05), but not the WT-VEH and A-VEH groups (_p_ > 0.05), showed significant reductions in investigation time, indicating that the WT-BDNF and A-BDNF groups formed LTM, whereas the other groups did not. *p < 0.05, compared with the first exposure. Error bars represent SEM.
