Structural insights to how mammalian capping enzyme reads the CTD code - PubMed (original) (raw)
Structural insights to how mammalian capping enzyme reads the CTD code
Agnidipta Ghosh et al. Mol Cell. 2011.
Abstract
Physical interaction between the phosphorylated RNA polymerase II carboxyl-terminal domain (CTD) and cellular capping enzymes is required for efficient formation of the 5' mRNA cap, the first modification of nascent mRNA. Here, we report the crystal structure of the RNA guanylyltransferase component of mammalian capping enzyme (Mce) bound to a CTD phosphopeptide. The CTD adopts an extended β-like conformation that docks Tyr1 and Ser5-PO(4) onto the Mce nucleotidyltransferase domain. Structure-guided mutational analysis verified that the Mce-CTD interface is a tunable determinant of CTD binding and stimulation of guanylyltransferase activity, and of Mce function in vivo. The location and composition of the CTD binding site on mammalian capping enzyme is distinct from that of a yeast capping enzyme that recognizes the same CTD primary structure. Thus, capping enzymes from different taxa have evolved different strategies to read the CTD code.
Copyright © 2011 Elsevier Inc. All rights reserved.
Figures
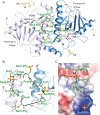
Figure1. Structure of the mammalian capping enzyme Mce in complex with phosphorylated Pol II CTD
A) A view of the Mce-CTD structure shown in ribbon representation with secondary structure elements indicated by arrows (β-strands) and ribbons (helices). A continuous thirteen amino acid CTD segment (in stick representation and colored green) interacts with two Mce protomers (protomer A and B). The NTase domains of the two protomers are labeled and colored in different shades of blue and the corresponding OB-fold domain elements that could be modeled are labeled and colored in yellow. N and C denote the location of the amino- and carboxy-terminus. The active site Lys294 and guanine base are labeled, shown in sticks and colored red and pale-yellow, respectively, to indicate the relative position of the Mce active site. All figures depicting structure were generated with PyMol (DeLano, 2002). B) A close-up view of the CTD associated with the two protomers of Mce. Mce is shown in ribbon representation with CTD residues labeled and represented by sticks. The distance between N and C termini of the CTD is denoted with an arrow. C) A close-up of Mce protomer A (surface representation colored by positive (blue) and negative (red) electrostatic potential). CTD residues are labeled and represented by sticks.
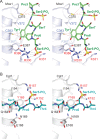
Figure 2. Capping enzyme interactions with phosphorylated CTD
A) Stereo diagram of interactions between Mce and CTD. Selected side chains and phosphoserine residues are shown in stick representation and labeled. Potential hydrogen bonds and van der Waals contacts are denoted with black and red dashed lines, respectively. Mce residues that interact with CTD Tyr1 and Ser5-PO4 are labeled in blue and red, respectively. B) Stereo view of C. albicans guanylyltransferase Cgt1 (in light gray) bound to CTD (stick representation and colored cyan) depicting the same surface of Cgt1 as shown for Mce in panel A. Potential hydrogen bonds with Ser5-PO4 are shown with black dashes, and residues that interact with Ser5-PO4 are labeled in red.
Figure 3. Genetic analysis of Mce-CTD interactions
A) Serial 10-fold dilutions of _S. cerevisiaeRPB1-WTceg1_Δ and _RPB1-11ceg1_Δ strains bearing indicated MCE1 alleles spotted on YPAD agar grown at 23°C (left), 30°C (middle), and 37°C (right). B) _S. cerevisiaeRPB1-WTceg1_Δ and _RPB1-11ceg1_Δ strains bearing pYX-MCE1 plasmids containing wild-type or mutant alleles K294A, R330A/K331A/C383Y, and V372Y/C383Y were assessed for growth at 30°C on agar medium lacking (left) or containing (right) 5-FOA. C) C375R mutation in the Mce-CTD interface results in a gain of function. A C375R substitution rescues conditional lethality in yeast when S. cerevisiae YBS50 _cet1_Δ_ceg1_Δ strain is complemented with a centromeric pRS412 plasmid containing _MCE1_-C375R flanked by CET1 5' and 3' UTR elements but not when complemented with a similar plasmid bearing MCE1 wild-type (WT) or CET1(276–549)-linker-MCE1(227–567) (Experimental Procedures). Strains were streaked on agar medium lacking (left) or containing (right) 5-FOA.
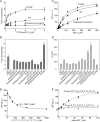
Figure 4. Stimulation of Mce guanylyltransferase activity by the CTD
A) Stimulation of Mce wild-type, R330A/K331A/C383Y and C375R mutant proteins by increasing concentrations of CTD Ser5-PO4 (Experimental Procedures). Error bars (one standard deviation) were calculated from three independent experiments performed in triplicate. B) The fold increase in guanylylation activity was calculated by comparing the amount of enzyme-guanylate at 0 and 8 μM CTD Ser5-PO4 and depicted by bar graphs with error bars (one standard deviation). C) Data obtained from fluorescence polarization assays used to derive Kd values for Mce wild-type, R330A/K331A/C383Y and C375R mutant proteins at pH 7.0 (Experimental Procedures). Error bars (one standard deviation) obtained from three independent experiments performed in triplicate. D) Summary of dissociation constants in bar graph representation with error bars (one standard deviation) as determined by fluorescence polarization assays for Mce wild-type or mutant proteins and phosphorylated CTD. E) Displacement of fluorescein labeled CTD peptide (Fluor-S2P3T4S5PP6S7Y1S2PP3T4S5) bound to Mce wild-type protein with increasing quantities of unlabeled peptide (S2P3T4S5PP6S7Y1S2PP3T4S5) (Experimental Procedures). Fluorescence polarization was measured after incubating ternary complexes on ice for 20 minutes. Error bars (one standard deviation) were calculated from three independent experiments performed in triplicate. F) Mce1-CTD interaction depends on CTD phosphorylation at Ser2 and Ser5 positions. Fluorescein labeled Ser2 and Ser5 phosphorylated (Fluor-S2P3T4S5PP6S7Y1S2PP3T4S5; filled circles) and labeled dephosphorylated CTD (Fluor-S2P3T4S5P6S7Y1SPP3T4S5; open circles) peptides were incubated with increasing concentrations of Mce wild-type protein (Experimental Procedures).
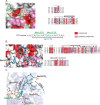
Figure 5. CTD interactions with yeast and mammalian capping enzymes
A) A close-up view and surface representation of the NTase domain of Mce (colored light gray) centered at the CTD binding site. Fully or partially conserved amino acids are colored in red or pink, respectively. Sequence conservation for Mce was generated by structure based sequence alignment of the corresponding metazoan NTase domains from M. musculus (Mm), H. sapiens (Hs), X. laevis (Xl), C. elegans (Ce), and A. thaliana (At). CTD residues are labeled, shown in stick representation and colored green. B) A closeup view of C. albicans Cgt1 surface (colored light gray) centered at the CTD binding site. Conserved residues are color coded as described in panel A. Sequence conservation was mapped on Cgt1 surface by aligning sequences corresponding to the NTase domains of C. albicans (Ca), S. cerevisiae (Sc), C. glabrata (Cg), K. lactis (Kl), and Y. lipolytica (Yl). CTD residues are shown in sticks, colored cyan and select positions are labeled. Aligned primary amino acid sequences are shown in the right panel and shaded according to sequence conservation. Secondary structure elements of Mce and Cgt1 are shown above the alignments. Residues in Mce or Cgt1 that are involved in H-bond and hydrophobic interactions are specified by red and blue circles above the sequence alignments, respectively. C) Surfaces of the NTase domains of Mce (blue) and Cgt1 (light gray) were superimposed to illustrate that the respective CTD elements (in stick representation colored as in panels A and B) are mostly non-overlapping and involve distinct surfaces of the Mce or Cgt1 NTase domains.
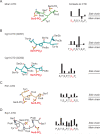
Figure 6. Conformational plasticity in CTD structures and mode of CTD recognition
CTD heptad arrays extracted from structures of A) Mce (in green), B) Cgt1- CDS1 and CDS2 (in cyan; PDB: 1P16), C) Pin1 (in orange; PDB: 1F8A), and D) Scp1 (in gray; PDB: 1GHQ). CTD segments shown in ribbon (main chain) and stick representation (side chain) were aligned vertically based on the position of the Ser5-PO4 Cα atom. Although approximate, the orientation of the CTD structures also places the respective binding partners below the CTD. Right panels indicate phased CTD heptad sequences in bar graph format to illustrate the number of contacts (magnitude of the bar height) between the respective binding partner and CTD side chains (above) and main chain (below).
Comment in
- Gimme phospho-serine five! Capping enzyme guanylyltransferase recognition of the RNA polymerase II CTD.
Burley SK, Sonenberg N. Burley SK, et al. Mol Cell. 2011 Jul 22;43(2):163-5. doi: 10.1016/j.molcel.2011.07.003. Mol Cell. 2011. PMID: 21777807
Similar articles
- How an mRNA capping enzyme reads distinct RNA polymerase II and Spt5 CTD phosphorylation codes.
Doamekpor SK, Sanchez AM, Schwer B, Shuman S, Lima CD. Doamekpor SK, et al. Genes Dev. 2014 Jun 15;28(12):1323-36. doi: 10.1101/gad.242768.114. Genes Dev. 2014. PMID: 24939935 Free PMC article. - Structure of an mRNA capping enzyme bound to the phosphorylated carboxy-terminal domain of RNA polymerase II.
Fabrega C, Shen V, Shuman S, Lima CD. Fabrega C, et al. Mol Cell. 2003 Jun;11(6):1549-61. doi: 10.1016/s1097-2765(03)00187-4. Mol Cell. 2003. PMID: 12820968 - The length, phosphorylation state, and primary structure of the RNA polymerase II carboxyl-terminal domain dictate interactions with mRNA capping enzymes.
Pei Y, Hausmann S, Ho CK, Schwer B, Shuman S. Pei Y, et al. J Biol Chem. 2001 Jul 27;276(30):28075-82. doi: 10.1074/jbc.M102170200. Epub 2001 May 31. J Biol Chem. 2001. PMID: 11387325 - A structural perspective of CTD function.
Meinhart A, Kamenski T, Hoeppner S, Baumli S, Cramer P. Meinhart A, et al. Genes Dev. 2005 Jun 15;19(12):1401-15. doi: 10.1101/gad.1318105. Genes Dev. 2005. PMID: 15964991 Review. - The polynucleotide ligase and RNA capping enzyme superfamily of covalent nucleotidyltransferases.
Shuman S, Lima CD. Shuman S, et al. Curr Opin Struct Biol. 2004 Dec;14(6):757-64. doi: 10.1016/j.sbi.2004.10.006. Curr Opin Struct Biol. 2004. PMID: 15582400 Review.
Cited by
- A Revision of Herpes Simplex Virus Type 1 Transcription: First, Repress; Then, Express.
Dunn LEM, Birkenheuer CH, Baines JD. Dunn LEM, et al. Microorganisms. 2024 Jan 26;12(2):262. doi: 10.3390/microorganisms12020262. Microorganisms. 2024. PMID: 38399666 Free PMC article. Review. - DDX6 transfers P-TEFb kinase to the AF4/AF4N (AFF1) super elongation complex.
Mück F, Bracharz S, Marschalek R. Mück F, et al. Am J Blood Res. 2016 Sep 15;6(3):28-45. eCollection 2016. Am J Blood Res. 2016. PMID: 27679741 Free PMC article. - Interplay of mRNA capping and transcription machineries.
Kachaev ZM, Lebedeva LA, Kozlov EN, Shidlovskii YV. Kachaev ZM, et al. Biosci Rep. 2020 Jan 31;40(1):BSR20192825. doi: 10.1042/BSR20192825. Biosci Rep. 2020. PMID: 31904821 Free PMC article. Review. - The Ess1 prolyl isomerase: traffic cop of the RNA polymerase II transcription cycle.
Hanes SD. Hanes SD. Biochim Biophys Acta. 2014;1839(4):316-33. doi: 10.1016/j.bbagrm.2014.02.001. Epub 2014 Feb 12. Biochim Biophys Acta. 2014. PMID: 24530645 Free PMC article. Review. - Fcp1 dephosphorylation of the RNA polymerase II C-terminal domain is required for efficient transcription of heat shock genes.
Fuda NJ, Buckley MS, Wei W, Core LJ, Waters CT, Reinberg D, Lis JT. Fuda NJ, et al. Mol Cell Biol. 2012 Sep;32(17):3428-37. doi: 10.1128/MCB.00247-12. Epub 2012 Jun 25. Mol Cell Biol. 2012. PMID: 22733996 Free PMC article.
References
- Becker R, Loll B, Meinhart A. Snapshots of the RNA processing factor SCAF8 bound to different phosphorylated forms of the carboxyl-terminal domain of RNA polymerase II. J Biol Chem. 2008;283:22659–22669. - PubMed
- Buratowski S. The CTD code. Nat Struct Biol. 2003;10:679–680. - PubMed
- Chapman RD, Heidemann M, Albert TK, Mailhammer R, Flatley A, Meisterernst M, Kremmer E, Eick D. Transcribing RNA polymerase II is phosphorylated at CTD residue serine-7. Science. 2007;318:1780–1782. - PubMed
- Chapman RD, Heidemann M, Hintermair C, Eick D. Molecular evolution of the RNA polymerase II CTD. Trends Genet. 2008;24:289–296. - PubMed
Publication types
MeSH terms
Substances
Grants and funding
- R01 GM052470/GM/NIGMS NIH HHS/United States
- P41 RR015301/RR/NCRR NIH HHS/United States
- R01 GM061906-12/GM/NIGMS NIH HHS/United States
- RR-15301/RR/NCRR NIH HHS/United States
- R01 GM061906-13/GM/NIGMS NIH HHS/United States
- GM052470/GM/NIGMS NIH HHS/United States
- R01 GM061906-11A1/GM/NIGMS NIH HHS/United States
- GM061906/GM/NIGMS NIH HHS/United States
- R01 GM061906/GM/NIGMS NIH HHS/United States
LinkOut - more resources
Full Text Sources
Molecular Biology Databases
Miscellaneous
