Characterization and improvement of RNA-Seq precision in quantitative transcript expression profiling - PubMed (original) (raw)
Characterization and improvement of RNA-Seq precision in quantitative transcript expression profiling
Paweł P Łabaj et al. Bioinformatics. 2011.
Abstract
Motivation: Measurement precision determines the power of any analysis to reliably identify significant signals, such as in screens for differential expression, independent of whether the experimental design incorporates replicates or not. With the compilation of large-scale RNA-Seq datasets with technical replicate samples, however, we can now, for the first time, perform a systematic analysis of the precision of expression level estimates from massively parallel sequencing technology. This then allows considerations for its improvement by computational or experimental means.
Results: We report on a comprehensive study of target identification and measurement precision, including their dependence on transcript expression levels, read depth and other parameters. In particular, an impressive recall of 84% of the estimated true transcript population could be achieved with 331 million 50 bp reads, with diminishing returns from longer read lengths and even less gains from increased sequencing depths. Most of the measurement power (75%) is spent on only 7% of the known transcriptome, however, making less strongly expressed transcripts harder to measure. Consequently, <30% of all transcripts could be quantified reliably with a relative error<20%. Based on established tools, we then introduce a new approach for mapping and analysing sequencing reads that yields substantially improved performance in gene expression profiling, increasing the number of transcripts that can reliably be quantified to over 40%. Extrapolations to higher sequencing depths highlight the need for efficient complementary steps. In discussion we outline possible experimental and computational strategies for further improvements in quantification precision.
Contact: rnaseq10@boku.ac.at
Figures
Fig. 1.
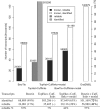
Statistics of identified and reliably measured transcripts. The plot compares, for different read processing methods, the number of transcripts identified (white and light bars), as well as the number of transcripts that could be measured reliably, i.e. where expression levels could be quantified with an error of 20% or less (black and dark bars). The grey bars are for gene models constructed de novo. The black and white bars are for known spliceforms as given by the EnsEMBL gene models. The alternate _y_-axis on the right gives the corresponding fraction of all spliceforms known (EnsEMBL, numbers given in brackets). The last table row gives the ratio of reliably measured transcript relative to the number of identified transcripts. The plot considers four different approaches of computing transcript expression from the observed reads. The first couple of bars assesses read alignments to the transcriptome from Bowtie with subsequent calculation of expression levels from the unambiguously mapping reads. Only 24 081 spliceforms could be measured reliably. The next group shows results for the established programs TopHat and Cufflinks, where an alignment of reads to the genome is followed by expression level estimates from de novo constructed gene models. While more transcripts can now be assessed reliably (35 405), also an extremely large number of spliceforms is predicted (off-scale). When Cufflinks is allowed to use the known EnsEMBL gene models, the number of reliably measurable transcripts increases to 39 116 or 28% of all known spliceforms. The approach of read alignment to the transcriptome by Bowtie combined with gene model based expression level estimates by Cufflinks identifies the largest number of known transcripts (72%) and allows the reliable measurement of 56 980, that is 41% of all known transcripts.
Fig. 2.
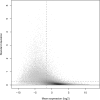
Standard deviation versus expression level. The plot shows the variation across three technical replicate measurements (standard deviation, _y_-axis), with each discernible dot representing a transcript target. In shaded areas, the grey level represents density, with dark shading indicating higher densities. The standard deviation is in general larger for transcripts with lower mean expression level (_x_-axis). More strongly expressed transcripts could often be measured reliably, with a relative error of 20% or less. Interestingly, just 41% of all transcript targets could be measured that precisely (below the horizontal dashed line). Of the 41% most strongly expressed transcripts (to the right of the vertical dashed line), on the other hand, 84% could be measured reliably (below the horizontal dashed line). This is reflected by the high density of targets on the right (dark shading) falling largely below the horizontal line, which is not the case to the left of the vertical dashed line.
Fig. 3.
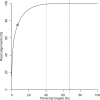
Cumulative distribution of read alignments across transcript targets. The fraction of read alignments is plotted (_y_-axis) that has been mapped to a certain percentage of transcript targets (_x_-axis). Over 75% of all read alignments cover less than 7% of the known transcriptome (circle symbol). Two particular positions are marked by vertical lines in the figure: The 41% of targets with the highest expression are to the left of the first line (dotted). The vast majority of read alignments (99.5%) has been assigned to these targets, supporting a reliable measurement of their expression levels. Consequently, most of them (84%) could be determined with an error of 20% or less. On average, 67% of all transcript targets were identified in a measurement and this is marked by the second line (dashed). A substantial number of transcript targets falls between the two lines, receiving as few as only one read alignment. Consequently, most of these targets could not be quantified reliably. The remaining 33% of transcript targets falling to the right of the second line (dashed) were either undetected or not expressed.
Fig. 4.
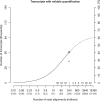
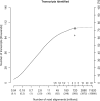
Transcripts with reliable quantification versus read depth. This graph plots the number of of transcript targets that could be measured reliably with a relative error of 20% or less versus the number of read alignments (_x_-axis). The total number of generated reads is given in parentheses below. Additional tick marks indicate proportions of a flowcell or the number of flowcells worth of sequencing. The alternate _y_-axis on the right shows the percentage of all known transcripts measured reliably. The solid line shows the results for the introduced combined quantification approach (Bowtie+Cufflinks+model). The dependency of the number of transcripts with reliable quantification on the number of read alignments can be described as a function with a sigmoid shape (regression P<10−15). The circle symbol indicates 41%, as achieved with an entire flowcell per replicate (331 million reads). Extrapolation of the fitted sigmoid suggests that about 60% can be reached at 10 billion reads, highlighting the need for efficient complementary steps. See text for discussion. See text for discussion. In comparison, the plus sign shows the corresponding result for an established standard approach (TopHat+Cufflinks+model), 28% of all known transcripts. The data shown is for the total, pooled set of reads.
Fig. 5.
Transcript identification versus read depth. This plot shows the number of detected transcript targets versus the number of read alignments (_x_-axis). The total number of generated reads is given in parentheses below. Additional tick marks indicate proportions of a flowcell or the number of flowcells worth of sequencing. The alternate _y_-axis on the right shows the percentage of all known transcripts detected. The solid line shows the results for the introduced combined quantification approach (Bowtie+Cufflinks+model). The dependency of the number of transcripts identified on the number of read alignments can be described as a function with a sigmoid shape (regression P<10−12). The circle symbol indicates 72%, as obtained with the entire set of 993 million reads. The remaining 28% were either undetected or not expressed in the studied sample. Extrapolation of the sigmoid fit suggests that even with an infinite number of reads only marginally more transcripts would be expected to be identified, yielding an estimate of 20% of transcript targets that are actually not expressed. As a consequence, this experiment reached a target recall of 90% of the estimated true transcript population of the sample. A single flowcell already achieved 84%. In comparison, the plus sign plots the corresponding result for an established standard approach (TopHat+Cufflinks+model), which identified 63% of all known transcripts, which is 79% of the estimated true transcript population. Results are shown for the entire dataset, pooling reads from all replicates.
Fig. 6.
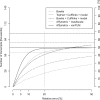
Comparison of measurement variation. The graph compares the rescaled cumulative distributions of the standard deviation for alternative technologies and data processing protocols.
Fig. 7.
Alternative RNA-Seq application schemas. (a) In an iterative approach, high-abundance transcripts can be identified in low-read sequencing runs, followed by iterative subtraction of the sequences dominating each sample. A profile from the combined runs promises higher measurement precision of expression levels for weakly to moderately expressed transcripts. (b) After normalization of an aliquot (top row), the strength of RNA-Seq in de novo sequence discovery can be exploited for the compilation of a comprehensive target library, against which a custom microarray can then be designed easily (Leparc et al., 2009) The remaining aliquot can then be quantitatively profiled on this optimized array (bottom row). The performance of both approaches of course depends on the quality of the subtraction or normalization step, respectively.
Similar articles
- Empirical assessment of the impact of sample number and read depth on RNA-Seq analysis workflow performance.
Baccarella A, Williams CR, Parrish JZ, Kim CC. Baccarella A, et al. BMC Bioinformatics. 2018 Nov 14;19(1):423. doi: 10.1186/s12859-018-2445-2. BMC Bioinformatics. 2018. PMID: 30428853 Free PMC article. - High-resolution transcriptome analysis with long-read RNA sequencing.
Cho H, Davis J, Li X, Smith KS, Battle A, Montgomery SB. Cho H, et al. PLoS One. 2014 Sep 24;9(9):e108095. doi: 10.1371/journal.pone.0108095. eCollection 2014. PLoS One. 2014. PMID: 25251678 Free PMC article. - MITIE: Simultaneous RNA-Seq-based transcript identification and quantification in multiple samples.
Behr J, Kahles A, Zhong Y, Sreedharan VT, Drewe P, Rätsch G. Behr J, et al. Bioinformatics. 2013 Oct 15;29(20):2529-38. doi: 10.1093/bioinformatics/btt442. Epub 2013 Aug 25. Bioinformatics. 2013. PMID: 23980025 Free PMC article. - Misuse of RPKM or TPM normalization when comparing across samples and sequencing protocols.
Zhao S, Ye Z, Stanton R. Zhao S, et al. RNA. 2020 Aug;26(8):903-909. doi: 10.1261/rna.074922.120. Epub 2020 Apr 13. RNA. 2020. PMID: 32284352 Free PMC article. Review. - Differential Expression Analysis of RNA-seq Reads: Overview, Taxonomy, and Tools.
Chowdhury HA, Bhattacharyya DK, Kalita JK. Chowdhury HA, et al. IEEE/ACM Trans Comput Biol Bioinform. 2020 Mar-Apr;17(2):566-586. doi: 10.1109/TCBB.2018.2873010. Epub 2018 Oct 1. IEEE/ACM Trans Comput Biol Bioinform. 2020. PMID: 30281477 Review.
Cited by
- Physico-chemical foundations underpinning microarray and next-generation sequencing experiments.
Harrison A, Binder H, Buhot A, Burden CJ, Carlon E, Gibas C, Gamble LJ, Halperin A, Hooyberghs J, Kreil DP, Levicky R, Noble PA, Ott A, Pettitt BM, Tautz D, Pozhitkov AE. Harrison A, et al. Nucleic Acids Res. 2013 Mar 1;41(5):2779-96. doi: 10.1093/nar/gks1358. Epub 2013 Jan 9. Nucleic Acids Res. 2013. PMID: 23307556 Free PMC article. Review. - Effect of chronic intermittent ethanol vapor exposure on RNA content of brain-derived extracellular vesicles.
Baratta AM, Mangieri RA, Aziz HC, Lopez MF, Farris SP, Homanics GE. Baratta AM, et al. Alcohol. 2022 Dec;105:9-24. doi: 10.1016/j.alcohol.2022.08.006. Epub 2022 Aug 30. Alcohol. 2022. PMID: 36055466 Free PMC article. - RNA-seq Data: Challenges in and Recommendations for Experimental Design and Analysis.
Williams AG, Thomas S, Wyman SK, Holloway AK. Williams AG, et al. Curr Protoc Hum Genet. 2014 Oct 1;83:11.13.1-20. doi: 10.1002/0471142905.hg1113s83. Curr Protoc Hum Genet. 2014. PMID: 25271838 Free PMC article. - Long noncoding RNAs in psychiatric disorders.
Zuo L, Tan Y, Wang Z, Wang KS, Zhang X, Chen X, Li CS, Wang T, Luo X. Zuo L, et al. Psychiatr Genet. 2016 Jun;26(3):109-16. doi: 10.1097/YPG.0000000000000129. Psychiatr Genet. 2016. PMID: 26974119 Free PMC article. Review. - A survey of best practices for RNA-seq data analysis.
Conesa A, Madrigal P, Tarazona S, Gomez-Cabrero D, Cervera A, McPherson A, Szcześniak MW, Gaffney DJ, Elo LL, Zhang X, Mortazavi A. Conesa A, et al. Genome Biol. 2016 Jan 26;17:13. doi: 10.1186/s13059-016-0881-8. Genome Biol. 2016. PMID: 26813401 Free PMC article. Review.
References
- Blow N. Transcriptomics: the digital generation. Nature. 2009;458:239–242. - PubMed
- Bolstad B. PhD Thesis. Berkeley, USA: University of California; 2004. Low level analysis of high-density oligonucleotide array data: background, normalization and summarization.
