Simulations of nuclear pore transport yield mechanistic insights and quantitative predictions - PubMed (original) (raw)
Simulations of nuclear pore transport yield mechanistic insights and quantitative predictions
Joshua S Mincer et al. Proc Natl Acad Sci U S A. 2011.
Abstract
To study transport through the nuclear pore complex, we developed a computational simulation that is based on known structural elements rather than a particular transport model. Results agree with a variety of experimental data including size cutoff for cargo transport with (30-nm diameter) and without (< 10 nm) nuclear localization signals (NLS), macroscopic transport rates (hundreds per second), and single cargo transit times (milliseconds). The recently observed bimodal cargo distribution is predicted, as is the relative invariance of single cargo transit times out to large size (even as macroscopic transport rate decreases). Additional predictions concern the effects of the number of NLS tags, the RanGTP gradient, and phenylalanine-glycine nucleopore protein (FG-Nup) structure, flexibility, and cross-linking. Results are consistent with and elucidate the molecular mechanisms of some existing hypotheses (selective phase, virtual gate, and selective gate models). A model emerges that is a hybrid of a number of preexisting models as well as a Brownian ratchet model, in which a cargo-karyopherin complex remains bound to the same FG-Nups for its entire trajectory through the nuclear pore complex until RanGTP severs the cargo-Nup bonds to effect release into the nucleus.
Conflict of interest statement
The authors declare no conflict of interest.
Figures
Fig. 1.
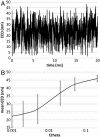
(A) End-to-end distance (EED) dynamics for a single FG-Nup anchored to the inner rim of the model NPC (filament radius 3 nm, length 55 nm, Ctheta = 0.002) and (B) as a function of Ctheta (mean EED ± SD).
Fig. 2.
FG-Nup interactions and dynamics as a function of FG-FG off rate. (A) Snapshots of FG-Nup dynamics looking at a side view of the NPC (from within the plane of the nuclear membrane) or into the NPC (from the cytosol or nucleus), for FG-FG off rate 104/s and for no FG-FG interactions. Scale bar is 30 nm. (B) FG repeat domain density histograms for a variety of FG-FG off rates. The beige box marks the thickness of a NPC. (C) The fraction of FG repeat domains that are bound to other FG repeat domains and absolute number of FG-FG bonds (Inset) as a function of FG-FG off rate for different FG-Nup landscapes.
Fig. 3.
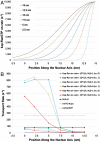
Effects of varying the RanGTP gradient. (A) Gradients of different width for maximum kap-RanGTP on rate of 104/s. Maximum [RanGTP], and hence maximum kap-RanGTP on rate, occurs at the nucleoplasmic entrance to the NPC, at position +15 nm along the nuclear axis. Wider gradients penetrate farther in that [RanGTP], and hence the kap-RanGTP on rate, falls to 10% of the maximum closer to the center of the NPC (position 0). For example, the red curve corresponds to a width of 15 nm because the on rate falls to 10% at position 0. (B) Effects on transport rates for one NLS versus zero cargo (10-nm diameter) simultaneously introduced into the pore (compare solid and dashed lines of the same color) for the various RanGTP gradients in the 1-ring system, no FG-FG interactions, and Ctheta = 0.02. Each point corresponds to a different RanGTP gradient: The maximum kap-RanGTP on rate is indicated by the color, as defined in the legend, whereas the gradient width is indicated by the x-axis value, as in A; i.e., the position along the nuclear axis at which [RanGTP] falls to 10% of its maximum. Also graphed are the rate of zero NLS cargo alone (black line), the rate in the absence of RanGTP (purple line) (illustrated for zero NLS cargo and identical to the rate for the competing one NLS cargo), and the rate in the absence of FG-Nups (yellow line).
Fig. 4.
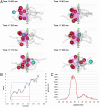
Analysis of cargo trajectories. (A) Snapshots from the trajectory of a 10-nm diameter cargo with one NLS (green sphere) in the 3-ring system (no FG-FG interactions, Ctheta = 0.02) (red sphere = other NLS cargo; pink filaments are bound to NLS cargo). (B) Quantitative analysis of the highlighted (green) trajectory in A: The black curve indicates the position over time, whereas each of the other curves represents the number of bonds between the cargo and a particular FG-Nup. (C) Histogram from combined transporting cargo trajectories, illustrating the cargo position density (i.e., probability of finding a single cargo at a given position).
Fig. 5.
Cargo dynamics: macroscopic transport rates (A, B, and D) and mean transit times (C and D) as a function of cargo size and number of NLS tags for different FG-FG off rates (A and C) and FG-Nup structure (r = FG-Nup filament radius) (B) and flexibility (Ctheta) (D). Results for A were produced in the 1-ring system, whereas those for B and D are from the 3-ring system (C features results from both). Unless otherwise specified, Ctheta = 0.02. FG-FG interactions are varied in A and C and turned off in B and D.
Fig. P1.
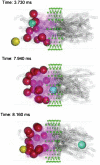
Snapshots from the trajectory of a 10-nm diameter cargo with 1 NLS (green sphere) in the 10-ring model NPC system (red spheres are other NLS cargo; yellow spheres are non-NLS cargo; gray filaments are FG-Nups; pink filaments are FG-Nups bound to NLS cargo).
Similar articles
- Karyopherins regulate nuclear pore complex barrier and transport function.
Kapinos LE, Huang B, Rencurel C, Lim RYH. Kapinos LE, et al. J Cell Biol. 2017 Nov 6;216(11):3609-3624. doi: 10.1083/jcb.201702092. Epub 2017 Sep 1. J Cell Biol. 2017. PMID: 28864541 Free PMC article. - Dissecting in vivo steady-state dynamics of karyopherin-dependent nuclear transport.
Lolodi O, Yamazaki H, Otsuka S, Kumeta M, Yoshimura SH. Lolodi O, et al. Mol Biol Cell. 2016 Jan 1;27(1):167-76. doi: 10.1091/mbc.E15-08-0601. Epub 2015 Nov 4. Mol Biol Cell. 2016. PMID: 26538027 Free PMC article. - A coarse-grained computational model of the nuclear pore complex predicts Phe-Gly nucleoporin dynamics.
Pulupa J, Rachh M, Tomasini MD, Mincer JS, Simon SM. Pulupa J, et al. J Gen Physiol. 2017 Oct 2;149(10):951-966. doi: 10.1085/jgp.201711769. Epub 2017 Sep 8. J Gen Physiol. 2017. PMID: 28887410 Free PMC article. - Mechanistic Insights from Structural Analyses of Ran-GTPase-Driven Nuclear Export of Proteins and RNAs.
Matsuura Y. Matsuura Y. J Mol Biol. 2016 May 22;428(10 Pt A):2025-39. doi: 10.1016/j.jmb.2015.09.025. Epub 2015 Oct 28. J Mol Biol. 2016. PMID: 26519791 Review. - Biomechanics of the transport barrier in the nuclear pore complex.
Stanley GJ, Fassati A, Hoogenboom BW. Stanley GJ, et al. Semin Cell Dev Biol. 2017 Aug;68:42-51. doi: 10.1016/j.semcdb.2017.05.007. Epub 2017 May 12. Semin Cell Dev Biol. 2017. PMID: 28506890 Review.
Cited by
- Physical motif clustering within intrinsically disordered nucleoporin sequences reveals universal functional features.
Ando D, Colvin M, Rexach M, Gopinathan A. Ando D, et al. PLoS One. 2013 Sep 16;8(9):e73831. doi: 10.1371/journal.pone.0073831. eCollection 2013. PLoS One. 2013. PMID: 24066078 Free PMC article. - Enhanced Nucleocytoplasmic Transport due to Competition for Elastic Binding Sites.
Fogelson B, Keener JP. Fogelson B, et al. Biophys J. 2018 Jul 3;115(1):108-116. doi: 10.1016/j.bpj.2018.05.034. Biophys J. 2018. PMID: 29972802 Free PMC article. - Effect of charge, hydrophobicity, and sequence of nucleoporins on the translocation of model particles through the nuclear pore complex.
Tagliazucchi M, Peleg O, Kröger M, Rabin Y, Szleifer I. Tagliazucchi M, et al. Proc Natl Acad Sci U S A. 2013 Feb 26;110(9):3363-8. doi: 10.1073/pnas.1212909110. Epub 2013 Feb 12. Proc Natl Acad Sci U S A. 2013. PMID: 23404701 Free PMC article. - Nuclear pore complex protein sequences determine overall copolymer brush structure and function.
Ando D, Zandi R, Kim YW, Colvin M, Rexach M, Gopinathan A. Ando D, et al. Biophys J. 2014 May 6;106(9):1997-2007. doi: 10.1016/j.bpj.2014.03.021. Biophys J. 2014. PMID: 24806932 Free PMC article. - Physics of the Nuclear Pore Complex: Theory, Modeling and Experiment.
Hoogenboom BW, Hough LE, Lemke EA, Lim RYH, Onck PR, Zilman A. Hoogenboom BW, et al. Phys Rep. 2021 Jul 25;921:1-53. doi: 10.1016/j.physrep.2021.03.003. Epub 2021 Mar 24. Phys Rep. 2021. PMID: 35892075 Free PMC article.
References
- Peters R. Translocation through the nuclear pore: Kaps pave the way. BioEssays. 2009;31:466–477. - PubMed
- Strawn LA, Shen T, Shulga N, Goldfarb DS, Wente SR. Minimal nuclear pore complexes define FG repeat domains essential for transport. Nat Cell Biol. 2004;6:197–206. - PubMed
- Frey S, Richter RP, Gorlich D. FG-rich repeats of nuclear pore proteins form a three-dimensional meshwork with hydrogel-like properties. Science. 2006;314:815–817. - PubMed
Publication types
MeSH terms
Substances
LinkOut - more resources
Full Text Sources
Other Literature Sources


