Range contraction in large pelagic predators - PubMed (original) (raw)
Range contraction in large pelagic predators
Boris Worm et al. Proc Natl Acad Sci U S A. 2011.
Abstract
Large reductions in the abundance of exploited land predators have led to significant range contractions for those species. This pattern can be formalized as the range-abundance relationship, a general macroecological pattern that has important implications for the conservation of threatened species. Here we ask whether similar responses may have occurred in highly mobile pelagic predators, specifically 13 species of tuna and billfish. We analyzed two multidecadal global data sets on the spatial distribution of catches and fishing effort targeting these species and compared these with available abundance time series from stock assessments. We calculated the effort needed to reliably detect the presence of a species and then computed observed range sizes in each decade from 1960 to 2000. Results suggest significant range contractions in 9 of the 13 species considered here (between 2% and 46% loss of observed range) and significant range expansions in two species (11-29% increase). Species that have undergone the largest declines in abundance and are of particular conservation concern tended to show the largest range contractions. These include all three species of bluefin tuna and several marlin species. In contrast, skipjack tuna, which may have increased its abundance in the Pacific, has also expanded its range size. These results mirror patterns described for many land predators, despite considerable differences in habitat, mobility, and dispersal, and imply ecological extirpation of heavily exploited species across parts of their range.
Conflict of interest statement
The authors declare no conflict of interest.
Figures
Fig. 1.
Mapping species ranges. Shown are raw data for Atlantic bluefin tuna (T. thynnus) and Pacific bluefin tuna (T. orientalis) in the 1960s (Left) and 1990s (Right). Depth-corrected Japanese longlining (A and B) and FAO catch data (C and D): white indicates no effort and gray indicates effort but no catch (Japanese data only); otherwise the colors indicate catch. (E and F) Combined raw data for use in the analysis. Gray indicates no data. Orange indicates Japanese data were used. Blue indicates FAO data were used. Presence is indicated by a white diagonal line, absence is indicated by no line. It can be seen how FAO data fill in gaps in the Japanese data, for example in the Gulf of Mexico, allowing the use of much more complete ranges. Cells with catch but without presences indicate occurrences below a specified presence threshold of five individuals (or five tons caught) per decade.
Fig. 2.
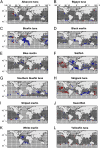
Changes in observed tuna and billfish ranges between the 1960s and 1990s. Cells that are occupied in both decades are indicated in gray, range loss over time is shown in blue, and range expansion in red.
Fig. 3.
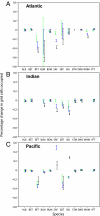
Range changes by decade. Shown are the observed range changes (±95% confidence interval) in the (A) Atlantic, (B) Indian, and (C) Pacific Ocean. Range extent relative to the 1960s: green symbols represent 1970s, blue 1980s, black 1990s. For species codes refer to Table 1. Positive values indicate a range expansion, negative a range contraction.
Fig. 4.
Abundance vs. observed range changes. Abundance estimates were derived from stock assessments published by the relevant management bodies and include yellowfin, skipjack, albacore, and Atlantic bluefin tuna, as well as swordfish stocks. Fitted line was derived from a generalized additive model.
Comment in
- Changes in ranges of large ocean fish.
Brown JH. Brown JH. Proc Natl Acad Sci U S A. 2011 Jul 19;108(29):11735-6. doi: 10.1073/pnas.1109139108. Epub 2011 Jul 6. Proc Natl Acad Sci U S A. 2011. PMID: 21734153 Free PMC article. No abstract available.
Similar articles
- Changes in ranges of large ocean fish.
Brown JH. Brown JH. Proc Natl Acad Sci U S A. 2011 Jul 19;108(29):11735-6. doi: 10.1073/pnas.1109139108. Epub 2011 Jul 6. Proc Natl Acad Sci U S A. 2011. PMID: 21734153 Free PMC article. No abstract available. - Accommodating dynamic oceanographic processes and pelagic biodiversity in marine conservation planning.
Grantham HS, Game ET, Lombard AT, Hobday AJ, Richardson AJ, Beckley LE, Pressey RL, Huggett JA, Coetzee JC, van der Lingen CD, Petersen SL, Merkle D, Possingham HP. Grantham HS, et al. PLoS One. 2011 Feb 2;6(2):e16552. doi: 10.1371/journal.pone.0016552. PLoS One. 2011. PMID: 21311757 Free PMC article. - Marine no-take zone rapidly benefits endangered penguin.
Pichegru L, Grémillet D, Crawford RJ, Ryan PG. Pichegru L, et al. Biol Lett. 2010 Aug 23;6(4):498-501. doi: 10.1098/rsbl.2009.0913. Epub 2010 Feb 10. Biol Lett. 2010. PMID: 20147313 Free PMC article. - Patterns and ecosystem consequences of shark declines in the ocean.
Ferretti F, Worm B, Britten GL, Heithaus MR, Lotze HK. Ferretti F, et al. Ecol Lett. 2010 Aug 1;13(8):1055-71. doi: 10.1111/j.1461-0248.2010.01489.x. Epub 2010 May 26. Ecol Lett. 2010. PMID: 20528897 Review. - The northern shrimp (Pandalus borealis) offshore fishery in the Northeast Atlantic.
Garcia EG. Garcia EG. Adv Mar Biol. 2007;52:147-266. doi: 10.1016/S0065-2881(06)52002-4. Adv Mar Biol. 2007. PMID: 17298891 Review.
Cited by
- Spawning of bluefin tuna in the Black Sea: historical evidence, environmental constraints and population plasticity.
MacKenzie BR, Mariani P. MacKenzie BR, et al. PLoS One. 2012;7(7):e39998. doi: 10.1371/journal.pone.0039998. Epub 2012 Jul 24. PLoS One. 2012. PMID: 22848367 Free PMC article. - Predicting overfishing and extinction threats in multispecies fisheries.
Burgess MG, Polasky S, Tilman D. Burgess MG, et al. Proc Natl Acad Sci U S A. 2013 Oct 1;110(40):15943-8. doi: 10.1073/pnas.1314472110. Epub 2013 Sep 16. Proc Natl Acad Sci U S A. 2013. PMID: 24043810 Free PMC article. - Decline of coastal apex shark populations over the past half century.
Roff G, Brown CJ, Priest MA, Mumby PJ. Roff G, et al. Commun Biol. 2018 Dec 13;1:223. doi: 10.1038/s42003-018-0233-1. eCollection 2018. Commun Biol. 2018. PMID: 30564744 Free PMC article. - Projected poleward shift of king penguins' (Aptenodytes patagonicus) foraging range at the Crozet Islands, southern Indian Ocean.
Péron C, Weimerskirch H, Bost CA. Péron C, et al. Proc Biol Sci. 2012 Jul 7;279(1738):2515-23. doi: 10.1098/rspb.2011.2705. Epub 2012 Feb 29. Proc Biol Sci. 2012. PMID: 22378808 Free PMC article. - The environmental niche of the global high seas pelagic longline fleet.
Crespo GO, Dunn DC, Reygondeau G, Boerder K, Worm B, Cheung W, Tittensor DP, Halpin PN. Crespo GO, et al. Sci Adv. 2018 Aug 8;4(8):eaat3681. doi: 10.1126/sciadv.aat3681. eCollection 2018 Aug. Sci Adv. 2018. PMID: 30101192 Free PMC article.
References
- Myers RA, Worm B. Rapid worldwide depletion of predatory fish communities. Nature. 2003;423:280–283. - PubMed
- Sibert J, Hampton J, Kleiber P, Maunder M. Biomass, size, and trophic status of top predators in the Pacific Ocean. Science. 2006;314:1773–1776. - PubMed
- Ferretti F, Worm B, Britten GL, Heithaus MR, Lotze HK. Patterns and ecosystem consequences of shark declines in the ocean. Ecol Lett. 2010;13:1055–1071. - PubMed
- Brown JH, Stevens GC, Kaufman DM. The geographic range: Size, shape, boundaries, and internal structure. Annu Rev Ecol Syst. 1996;27:597–623.
- Laliberte AS, Ripple WJ. Range contractions of North American carnivores and ungulates. Bioscience. 2004;54:123–138.
Publication types
MeSH terms
LinkOut - more resources
Full Text Sources


