Corticothalamic feedback controls sleep spindle duration in vivo - PubMed (original) (raw)
Corticothalamic feedback controls sleep spindle duration in vivo
Maxime Bonjean et al. J Neurosci. 2011.
Abstract
Spindle oscillations are commonly observed during stage 2 of non-rapid eye movement sleep. During sleep spindles, the cerebral cortex and thalamus interact through feedback connections. Both initiation and termination of spindle oscillations are thought to originate in the thalamus based on thalamic recordings and computational models, although some in vivo results suggest otherwise. Here, we have used computer modeling and in vivo multisite recordings from the cortex and the thalamus in cats to examine the involvement of the cortex in spindle oscillations. We found that although the propagation of spindles depended on synaptic interaction within the thalamus, the initiation and termination of spindle sequences critically involved corticothalamic influences.
Figures
Figure 1.
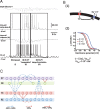
Basic spindle properties and model topology. A, Field potential and simultaneous recordings from cortical and thalamocortical neurons. A recording from reticular thalamic neuron was obtained in a different experiment [modified from Timofeev and Bazhenov (2005)]. B(1), [Ca2+]i-dependent shift in the activation curve of the hyperpolarization-activated h-type current, _I_h. T-type current, _I_T, allows Ca2+ ions to enter the cell, bind to the mixed Na+/K+ channel _I_h, and modify its voltage-dependent properties. B(2 ), Binding of Ca2+ ions to _I_h channels shifts the voltage dependence of the current toward positive membrane potentials. C, Model topology and structure of the thalamocortical network distributed into four different layers. The TC (thalamocortical relay) neurons and the thalamic RE (reticular) neurons formed two of the layers, strongly interacting with each other. The two cortical layers contained PY (pyramidal excitatory) neurons and IN (inhibitory) neurons. Connections between layers were stochastically distributed. Heterogeneity in the same layer was achieved through a random distribution of parameters for intrinsic properties (see Materials and Methods for details).
Figure 2.
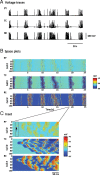
Simulated spindle oscillations. A, Voltage traces of individual neurons [PY (cortical pyramidal), TC (thalamocortical), and RE (reticular thalamic)] in each layer of the thalamocortical network during a 50 s simulation of spindle activity. B, Space–time plot representing the activity of the whole network for 25 s, showing the pattern of wave propagation within the network. Individual membrane potential activity from A corresponds to the cell in the middle of each respective layer (Cell #50 of TC, RE, and PY) of B. The value of the membrane potential for each neuron is coded by the false color scale. C, Enlargement for 350 ms of the space plot in B showing a spontaneous initiation of a spindle cycle. A small subset of PY cells accounted for the genesis of the cycle (black arrow), and RE cells were then recruited. TC cells exhibited far less bursting than RE cells at the beginning of this spindle sequence, and the level of synchrony was lower than that for the middle phase of a sequence.
Figure 3.
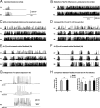
Network mechanisms leading to spindle termination. A, Membrane potentials of TC and RE cells during a 10 s simulation of spindles generated in the thalamic model in absence of the cortex. One occurrence of a spindle sequence with waxing-and-waning properties was initiated by an external stimulation to the RE network. B, The [Ca2+]i influence on h-type current conductance (upregulation) was reduced by ∼55% compared to the value used in A, below the threshold that terminates spindles. The oscillation became continuous. C, The cortical network was added to the model used in B. The total synaptic strength of cortical feedback per cell was identical to the value used in Figure 2_A_ and was sufficient to elicit synchronization of the network but unable to cause spindle termination in presence of a weak Ca2+ upregulation. D, Radii of the corticothalamic (PY→TC) and thalamocortical (TC→PY) afferent projections were doubled from the value used in C. Keeping Ca2+ upregulation low caused a few spontaneous spindle terminations to occur sporadically, but the duration of spindles remained excessively long. E, The total synaptic strength of cortical feedback per cell (PY→{TC,RE}) was doubled from the strength level used in C, while the radius of cortical afferents was the same as that in D. A few spindle epochs are apparent with evidence of a waxing-and-waning pattern (mostly at the beginning of the simulation). F, The total synaptic strength of cortical feedback per cell was quadrupled compared to the value used in C, while the radius of cortical afferents was kept constant from D. The waxing-and-waning envelope of the spindle has shape and duration comparable to the simulation in Figure 2. This demonstrates that a sufficiently strong cortical feedback coupled to a weak Ca2+ upregulation was sufficient for spindle termination and could control the duration of each spindle sequence. G, Membrane potential traces of PY, TC, and RE neurons during a typical waxing-and-waning spindle sequence obtained from a simulation using parameters as described for F. Compare this panel with in vivo data from Figure 1_A_. H, Statistical comparison of modeling and in vivo data: Left, frequency; right, average spindle sequence duration (1 and 2) and average inter-spindle interval duration (1* and 2*). All differences are statistically nonsignificant, showing that the modeling results agree well with in vivo data.
Figure 4.
Differential impact of cortical feedback on spindle pattern. A, Spindle pattern generation for a range of corticothalamic conductances (PY→TC and PY→RE). The Ca2+ upregulation was low and kept constant in all simulations. Three qualitatively distinct regions (Region I, isolated; Region II, continuous; Region III, repetitive) of spindle pattern activity can be distinguished depending on the strength of the cortical feedback. A typical pattern behavior of the TC membrane potential illustrates each of these regions. The borders separating these regions depended on several factors, and the solid lines are smoothed and stylized. B, Total spindling time shown in false color for a range of corticothalamic conductance strengths. Compare to the three regions identified in A. C, Inter-spindle duration in false color, averaged across each simulation, for each point in the diagram of corticothalamic conductance strengths. The longest and shortest inter-spindle durations occurred for isolated spindle patterns and nonterminating oscillations at spindle frequency, respectively. D. Generation of spindle pattern for a range of synaptic conductances (feedforward TC→PY/IN and feedback PY→TC). The thalamocortical (TC→PY/IN) feedforward connection strengths strongly influence spindle pattern. Repetitive spindle patterns were observed only for a narrow range of connection strengths.
Figure 5.
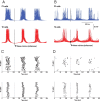
IPSP-triggered analysis of spindles in the model. Traces are aligned by minima of TC cell voltage (arrows) to show that cortical population activity is phase locked with TC neurons for each cycle of the spindle oscillation during the middle phase of a spindle. A, Middle phase of a spindle. B, Waning phase (end) of a spindle. C, Raster plots of TC and PY spikes corresponding to the activity in A, showing that TC and PY activities are phase locked in the middle of a spindle sequence. D, Raster plots of TC and PY spikes corresponding to the activity in B, showing that TC and PY activities are more desynchronized at the end of a spindle sequence.
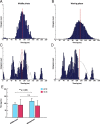
Figure 6.
Firing distribution triggered by IPSP in model TC neurons. A, B, Time lag between TC and PY cells firing during the middle of a spindle (A) and during the waning phase (B). The envelope of the histogram in B has a lower amplitude and a wider distribution than that in A, suggesting great variance in the time lag differences between the IPSP before the TC burst and the onset of a spike in an afferent PY cell. The synchronization between cortical and thalamic cells during the middle of a spindle epoch is greater than during the waning phase. C, D, Time lag between TC cells during the middle of a spindle (C) and during the waning phase (D). The red bars show the mean values of the histogram in (A) and (B), respectively. The envelope of the histograms in A and B are superimposed in gray in C and D, respectively. E, Bar plot of mean time lag differences. There was a significant difference between the means for A (91.2 ± 14.8) and B (114.3 ± 20.2) (p < 0.005) (left), but there was no significant difference between the means for C (87.1 ± 38.2) and D (81.5 ± 35.3) (right).
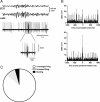
Figure 7.
Action potential firing in neurons from motor cortex (area 4) during spindles. A, Example of typical simultaneous field potentials and juxtacellular recordings (bottom traces) illustrating bursting at termination of spindles compared to EEG recordings (top traces). The shaded box on the juxtacellular trace is expanded below. B, Histograms of spikes count occurring 1000 ms (bins of 5 ms) around spindles onset (top) and waning (bottom). Note that spikes count is higher at termination than at onset. C, Proportion of neurons that fire at spindle termination: 86.36% (white area) had unchanged firing rate, while 9.09% (gray area) increased their firing rate without bursting and 4.55% (black area) increased their firing rate while bursting.
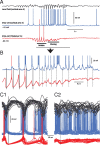
Figure 8.
Thalamocortical synchronization at the early, middle, and late portions of spindles in motor cortex and thalamus. A, Simultaneous intracellular recordings during spindles from area 4 of the motor cortex (blue) and the VL nucleus of the thalamus (red). Top trace, Local field potential from motor cortical area 4. Middle trace, Intracellular recording from the same cortical area. Bottom trace, Intracellular recording from the corresponding thalamic VL nucleus. Note that at spindle onset, the thalamocortical neuron exhibits rhythmic IPSPs without rebound action potentials, and the cortical neuron does not show rhythmic EPSPs. B, Expanded from A as indicated by the horizontal line. During waxing but not waning phases, the cortical neuron has rhythmic depolarizing potentials in synchrony with oscillations in the thalamocortical neuron. C1, Superposition of segments of local field potentials and intracellular activities of cortical and thalamocortical neurons during an early phase of spindles. Zero time is set at the maximal hyperpolarization achieved by thalamocortical neurons during a particular cycle of spindle (vertical line). C2, The same arrangement as in C1 but for the waxing phase of the spindle, showing desynchronization between thalamic and cortical firing.
Similar articles
- Spatiotemporal patterns of spindle oscillations in cortex and thalamus.
Contreras D, Destexhe A, Sejnowski TJ, Steriade M. Contreras D, et al. J Neurosci. 1997 Feb 1;17(3):1179-96. doi: 10.1523/JNEUROSCI.17-03-01179.1997. J Neurosci. 1997. PMID: 8994070 Free PMC article. - Prediction and verification of nonlinear sleep spindle harmonic oscillations.
Abeysuriya RG, Rennie CJ, Robinson PA. Abeysuriya RG, et al. J Theor Biol. 2014 Mar 7;344:70-7. doi: 10.1016/j.jtbi.2013.11.013. Epub 2013 Nov 26. J Theor Biol. 2014. PMID: 24291492 - Control of spatiotemporal coherence of a thalamic oscillation by corticothalamic feedback.
Contreras D, Destexhe A, Sejnowski TJ, Steriade M. Contreras D, et al. Science. 1996 Nov 1;274(5288):771-4. doi: 10.1126/science.274.5288.771. Science. 1996. PMID: 8864114 - Integration of low-frequency sleep oscillations in corticothalamic networks.
Amzica F, Steriade M. Amzica F, et al. Acta Neurobiol Exp (Wars). 2000;60(2):229-45. doi: 10.55782/ane-2000-1343. Acta Neurobiol Exp (Wars). 2000. PMID: 10909181 Review. - Corticothalamic resonance, states of vigilance and mentation.
Steriade M. Steriade M. Neuroscience. 2000;101(2):243-76. doi: 10.1016/s0306-4522(00)00353-5. Neuroscience. 2000. PMID: 11074149 Review.
Cited by
- Spindle power is not affected after spontaneous K-complexes during human NREM sleep.
Koupparis AM, Kokkinos V, Kostopoulos GK. Koupparis AM, et al. PLoS One. 2013;8(1):e54343. doi: 10.1371/journal.pone.0054343. Epub 2013 Jan 10. PLoS One. 2013. PMID: 23326604 Free PMC article. - Associations Between Sleep Spindle Metrics, Age, Education and Executive Function in Young Adult and Middle-Aged Patients with Obstructive Sleep Apnea.
Sui R, Li J, Shi Y, Yuan S, Wang H, Liao J, Gao X, Han D, Li Y, Wang X. Sui R, et al. Nat Sci Sleep. 2024 Jan 6;16:1-15. doi: 10.2147/NSS.S436824. eCollection 2024. Nat Sci Sleep. 2024. PMID: 38213412 Free PMC article. - Just a sound: A non-pharmacological treatment approach in epilepsy.
Timofeev I. Timofeev I. Cell Rep Med. 2021 Nov 16;2(11):100451. doi: 10.1016/j.xcrm.2021.100451. eCollection 2021 Nov 16. Cell Rep Med. 2021. PMID: 34841296 Free PMC article. - Sleep spindles in primates: Modeling the effects of distinct laminar thalamocortical connectivity in core, matrix, and reticular thalamic circuits.
Yazdanbakhsh A, Barbas H, Zikopoulos B. Yazdanbakhsh A, et al. Netw Neurosci. 2023 Jun 30;7(2):743-768. doi: 10.1162/netn_a_00311. eCollection 2023. Netw Neurosci. 2023. PMID: 37397882 Free PMC article. - Thalamic feedback shapes brain responses evoked by cortical stimulation in mice and humans.
Russo S, Claar LD, Furregoni G, Marks LC, Krishnan G, Zauli FM, Hassan G, Solbiati M, d'Orio P, Mikulan E, Sarasso S, Rosanova M, Sartori I, Bazhenov M, Pigorini A, Massimini M, Koch C, Rembado I. Russo S, et al. Nat Commun. 2025 Apr 16;16(1):3627. doi: 10.1038/s41467-025-58717-2. Nat Commun. 2025. PMID: 40240330 Free PMC article.
References
- Andersen P, Andersson S, Lomo T. Thalamo-cortical relations during spontaneous barbiturate spindles. Electroencephalogr Clin Neurophysiol. 1968;24:90. - PubMed
- Bal T, McCormick DA. What stops synchronized thalamocortical oscillations? Neuron. 1996;17:297–308. - PubMed
Publication types
MeSH terms
Grants and funding
- R01 NS060870/NS/NINDS NIH HHS/United States
- R01 EB009282/EB/NIBIB NIH HHS/United States
- 1R01 EB009282/EB/NIBIB NIH HHS/United States
- 1R01 NS060870/NS/NINDS NIH HHS/United States
- MOP-37862/CAPMC/ CIHR/Canada
- HHMI/Howard Hughes Medical Institute/United States
- MOP-67175/CAPMC/ CIHR/Canada
LinkOut - more resources
Full Text Sources
Miscellaneous
