A role for the primary cilium in Notch signaling and epidermal differentiation during skin development - PubMed (original) (raw)
A role for the primary cilium in Notch signaling and epidermal differentiation during skin development
Ellen J Ezratty et al. Cell. 2011.
Abstract
Ciliogenesis precedes lineage-determining signaling in skin development. To understand why, we performed shRNA-mediated knockdown of seven intraflagellar transport proteins (IFTs) and conditional ablation of Ift-88 and Kif3a during embryogenesis. In both cultured keratinocytes and embryonic epidermis, all of these eliminated cilia, and many (not Kif3a) caused hyperproliferation. Surprisingly and independent of proliferation, ciliary mutants displayed defects in Notch signaling and commitment of progenitors to differentiate. Notch receptors and Notch-processing enzymes colocalized with cilia in wild-type epidermal cells. Moreover, differentiation defects in ciliary mutants were cell autonomous and rescued by activated Notch (NICD). By contrast, Shh signaling was neither operative nor required for epidermal ciliogenesis, Notch signaling, or differentiation. Rather, Shh signaling defects in ciliary mutants occurred later, arresting hair follicle morphogenesis in the skin. These findings unveil temporally and spatially distinct functions for primary cilia at the nexus of signaling, proliferation, and differentiation.
Copyright © 2011 Elsevier Inc. All rights reserved.
Figures
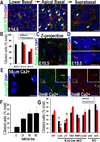
Figure 1. Ciliogenesis in developing epidermis occurs after cell polarity and prior to Shh, Notch and Wnt signaling
(A, B) Confocal immunofluorescence (IF) of whole-mount epidermis (planar views) was imaged for embryonic days and antibodies (Abs) indicated (color-coding according to secondary Abs). Note apically-oriented primary cilia in both basal and suprabasal cells. Arrows denote individual primary cilia, visualized by anti-acetylated tubulin. Cell-cell borders denoted by anti-E-cadherin; nuclei marked by DAPI. Histogram represents data from 3–4 embryos/condition where total number of ciliated cells was quantified in basal vs. suprabasal layers. (n=300–500 cells/condition). Data are represented as mean +/− SEM. (C) Confocal IF Z-projection of epidermis. Basal body is denoted by pericentrin; primary cilium is visualized by anti-acetylated tubulin. (D) Confocal IF of cilia co-labeled with IFT88 and acetylated tubulin Abs. (E) Differentiation-enhanced ciliogenesis in vitro. MKs before and after Ca+2–induced stratification and differentiation. Arrows denote individual primary cilia visualized by anti-acetylated tubulin or IFT88 Ab staining. Boxed region is magnified. (F) Histogram represents data from 2 independent experiments where %ciliated cells was quantified at times after shift. N≥500cells/condition. Data are represented as mean +/− SEM. (G) Ciliogenesis in E15.5 epidermis from mice of the genetically mutant backgrounds indicated (*denotes p<.001 compared to WT). Histogram provides ciliary quantifications of basal vs suprabasal cells from 3–4 embryos/condition. N=300–500cells/condition. Data are represented as mean +/− SEM. Scale bars= 10µM. See also Figure S1.
Figure 2. Depletion of IFTs in vitro impairs ciliogenesis but can also elicit non-ciliary defects in MT networks
Primary MKs were infected with the lentiviruses indicated, selected for puromycin resistance (viral integration) and then Ca+2-shifted 48 hr prior to analyses (A) _ShRNA_-mediated Ift KDs. Depletion of Ift88 and Ift172, but not Ift74, reduces levels of acetylated tubulin and inhibits Ca+2-induced MT reorganization. Arrows point to primary cilia present on MKs expressing scrambled shRNAs but not on cells depleted of IFT74, IFT88 or IFT172. Boxed regions are shown magnified below. Bars, 10µM. (B) Representative immunoblots of lysates from MKs expressing _Ift_-shRNAs indicated (S, scrambled shRNA). HPRT, loading control. (C, D) Quantifications of ciliogenesis, showing suppression upon IFT-depletion (C) and rescue of ciliogenesis defects upon overexpression of non-targeting Ift74 and Ift88 cDNAs (see methods). Histograms represent data from >2 independent experiments where cilia were quantified in shRNA KD cell lines after Ca+2-shift. See also Figure S2.
Figure 3. In utero knockdown of Ift74 or conditional knockout of Kif3a impairs ciliogenesis in developing epidermis
(A) Modified vector used to produce high titer lentivirus and H2B-RFP/Ift74-1 shRNA-transduced embryo. (B) Immunofluorescence shows that viral infection at E9.5 was restricted to epidermis, propagating H2B-RFP/scrambled shRNA expression to all infected progeny. (C) Cilia are eliminated in Ift74-1 shRNA-transduced epidermal cells (RFP+) but not neighboring uninfected cells (arrows). Histogram represents mean data from 2–3 embryos where cilia were quantified in RFP+ vs. RFP(−) basal and suprabasal cells from E15.5 epidermis. n=200–600 cells/condition. Bars are SEM. (D) Kif3a cKO inhibits ciliogenesis in comparison to WT (arrows). (E) Loss of kinesin-II reduces acetylated MTs in vivo (as in vitro). Scale bars, 10µM.
Figure 4. Depletion of IFTs vs kinesin II causes opposing defects on cell proliferation
(A) Kif3a cKO epidermis is thin compared to WT littermate controls. (B) Kinesin II-deficient epidermis is hypoproliferative. Quantifications of BrdU incorporation and phospho-H3+ cells in Kif3a WT vs. cKO epidermis. Data are from 2 embryos. (C–F) Ift74 KD and Ift88 cKO results in expansion of K14-expressing layers and hyperproliferation compared to scrambled or WT control. Abs/epifluors are color-coded. Quantifications of BrdU and phospho-H3 in WT and _Ift74_-shRNA-expressing cells. Histogram represents data from 2 embryos where BrdU+ basal cells were quantified. n=700–1000 cell/condition. E (G) Quantification of cell proliferation in LV-Cre transduced Kif3a (fl/fl) and (+/fl) MKs. (H) Inverse correlation between a cilium and the S/M phase of the epidermal cell cycle. Histogram represents data from ≥2 experiments where %Ki67+ S/M phase, ciliated cells were quantified in E14.5 basal and suprabasal epidermal cells in vivo or in MKs cultured 96 hr in medium containing Ca+2 levels indicated. Primary cilia are rarely observed in Ki67+ cells (arrows). (I) Quantification of cell proliferation in various IFT KD cell lines. (J) Rescue of cell hyperproliferation upon expression of targeting-refractory IFT74 and IFT88 (see methods). Histograms in G–H represent data from ≥2 experiments where %Ki67+ S/M phase, ciliated cells were quantified. All data is represented as mean and error bars are +/− SEM. Scale bars A,C,E 40µM. B,D,F 20µM, H 10µM. See also Figure S3.
Figure 5. Loss of primary cilia directly inhibits MK differentiation and Notch reporter activity
(A) In vitro, Ca+2 induces K10 in MKs expressing scrambled control but not Ift74 shRNAs. (B) Chloral hydrate-treatment blocks both ciliogenesis and K10 induction, under conditions where cytoplasmic MTs are unaffected (see also Figure S4). (C) Histograms represent data from 2 independent experiments where ciliated and K10-expressing cells were quantified and compared to untreated control cells. N≥200 cells/condition. (D–G) P0 MKs from a transgenic Notch reporter mouse also show Ca+2-induced Notch activity, diminished by chloral hydrate or KD of Ift74, Ift88 or Ift172. Histogram in (F–G) represents data from >2 independent experiments where GFP IF was measured in the shRNA-expressing or chloralhydrate treated cells and compared to scrambled controls. Histogram represents averaged data from 2 independent experiments where >200 cells/condition were analyzed. Error bars are +/− SEM. Scale bars=10 µM. See also Figure S4.
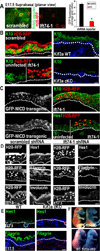
Figure 6. Elimination of primary cilia in vivo diminishes Notch signaling and inhibits basal to spinous cell fate commitment in developing epidermis
(A) Confocal images showing that Notch reporter activity (GFP) is induced suprabasally in E17.5 spinous epidermal cells expressing scrambled but not Ift74 shRNAs. Transduced cells are H2B-RFP+. Quantifications reveal 5X less GFP reporter expression in Ift74-deficient vs. control cells. Histogram represents averaged data from 2–3 embryos in which >200 RFP+ cells were analyzed. *indicates p<.001 by students t-test. Error bars are +/− SEM. Scale bar=10µM. (B) H2B-RFP(+) _Ift74_-shRNA transduced areas show reduced K10 compared to adjacent uninfected or scrambled shRNA-transduced epidermis. Kif3a cKO epidermis similarly shows diminished K10 in comparison to WT. (C) Transgenic expression of NICD-GFP rescues Ift74 shRNA-induced defects in K10 and Hes1 expression. (D–E) Repression of differentiation markers Hes1, filaggrin and invoIucrin correlates with loss of cilia rather than proliferative status. Transduced areas of hyperproliferative _Ift74_-shRNA-knockdown epidermis (D) (H2B-RFP+) show reduced differentiation compared to scrambled controls. *denotes background fluorescence; arrows note nuclear Hes1. Hypoproliferative Kif3a cKO epidermis (E) shows similar diminished differentiation. (F) Failure to exclude blue dye indicates defective skin barrier formation in _Ift74_-shRNA- transduced and Kif3a cKO E17.5 embryos. B–E Scale bars=45 µM except for Kif3a data, where bar=100 µM. See also Figure S5–6.
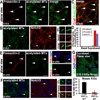
Figure 7. Notch signaling components are enriched at primary cilia in suprabasal epidermal cells
(A) Whole mount immunolocalization of Presenilin-2 (red) at basal body/ciliary structures (green) in suprabasal cells of developing E15.5 epidermis. (B) Whole mount of suprabasal E15.5 epidermis shows enriched Notch3 receptor immunolocalization at a subset of acetylated tubulin+ cilia (arrows), shown magnified in right panels. Neither Presenilin-2 nor Notch3 receptor were detected in the basal bodies/cilia in basal layer confocal planes. (C) Whole mount of suprabasal E15.5 epidermis shows lack of E-cadherin labeling (red) at cilia (green; arrows). (D) Quantification of % cilia with E-cadherin, Presenilin2 or Notch3 colocalization in basal and suprabasal confocal planes of E15.5 epidermis. n≥100 cells/condition. Data are represented as mean +/− SEM. (E) In vitro localization of Presenilin-2 at basal body/ciliary structures and in vitro co-localization of Presenilin-2 and the basal body/centrosome marker γ-tubulin. (F) In vitro localization of Notch3 at cilia in differentiating MKs. Arrows point to individual cilia shown magnified in the panels at right. (G) E16.5 mosaic skin from Kif3a cKO epidermis. Note WT cells (YFP−) showing NICD3 nuclear accumulation (red), while adjacent Kif3a null cells (YFP+) lack nuclear NICD3. Quantification of NICD(+) Kif3a cKO vs WT cells, where 200–300 cells from 2–3 embryos were quantified/per condition. Data are represented as mean +/− SEM. Scale bars=10 µM. See also Figure S7.
Similar articles
- A Presenilin-2-ARF4 trafficking axis modulates Notch signaling during epidermal differentiation.
Ezratty EJ, Pasolli HA, Fuchs E. Ezratty EJ, et al. J Cell Biol. 2016 Jul 4;214(1):89-101. doi: 10.1083/jcb.201508082. Epub 2016 Jun 27. J Cell Biol. 2016. PMID: 27354375 Free PMC article. - Intraflagellar transport 27 is essential for hedgehog signaling but dispensable for ciliogenesis during hair follicle morphogenesis.
Yang N, Li L, Eguether T, Sundberg JP, Pazour GJ, Chen J. Yang N, et al. Development. 2015 Jun 15;142(12):2194-202. doi: 10.1242/dev.115261. Epub 2015 May 28. Development. 2015. PMID: 26023097 Free PMC article. - Role of epidermal primary cilia in the homeostasis of skin and hair follicles.
Croyle MJ, Lehman JM, O'Connor AK, Wong SY, Malarkey EB, Iribarne D, Dowdle WE, Schoeb TR, Verney ZM, Athar M, Michaud EJ, Reiter JF, Yoder BK. Croyle MJ, et al. Development. 2011 May;138(9):1675-85. doi: 10.1242/dev.060210. Epub 2011 Mar 23. Development. 2011. PMID: 21429982 Free PMC article. - Epidermal Notch signalling: differentiation, cancer and adhesion.
Watt FM, Estrach S, Ambler CA. Watt FM, et al. Curr Opin Cell Biol. 2008 Apr;20(2):171-9. doi: 10.1016/j.ceb.2008.01.010. Epub 2008 Mar 14. Curr Opin Cell Biol. 2008. PMID: 18342499 Free PMC article. Review. - Homeostases of epidermis and hair follicle, and development of basal cell carcinoma.
Jaiswal A, Singh R. Jaiswal A, et al. Biochim Biophys Acta Rev Cancer. 2022 Sep;1877(5):188795. doi: 10.1016/j.bbcan.2022.188795. Epub 2022 Sep 9. Biochim Biophys Acta Rev Cancer. 2022. PMID: 36089203 Review.
Cited by
- Loss of Notch1 disrupts the barrier repair in the corneal epithelium.
Movahedan A, Afsharkhamseh N, Sagha HM, Shah JR, Milani BY, Milani FY, Logothetis HD, Chan CC, Djalilian AR. Movahedan A, et al. PLoS One. 2013 Jul 18;8(7):e69113. doi: 10.1371/journal.pone.0069113. Print 2013. PLoS One. 2013. PMID: 23874882 Free PMC article. - A Tale of Two Joints: The Role of Matrix Metalloproteases in Cartilage Biology.
Rose BJ, Kooyman DL. Rose BJ, et al. Dis Markers. 2016;2016:4895050. doi: 10.1155/2016/4895050. Epub 2016 Jul 13. Dis Markers. 2016. PMID: 27478294 Free PMC article. Review. - Planar cell polarity effector gene Intu regulates cell fate-specific differentiation of keratinocytes through the primary cilia.
Dai D, Li L, Huebner A, Zeng H, Guevara E, Claypool DJ, Liu A, Chen J. Dai D, et al. Cell Death Differ. 2013 Jan;20(1):130-8. doi: 10.1038/cdd.2012.104. Epub 2012 Aug 31. Cell Death Differ. 2013. PMID: 22935613 Free PMC article. - Defects in the Exocyst-Cilia Machinery Cause Bicuspid Aortic Valve Disease and Aortic Stenosis.
Fulmer D, Toomer K, Guo L, Moore K, Glover J, Moore R, Stairley R, Lobo G, Zuo X, Dang Y, Su Y, Fogelgren B, Gerard P, Chung D, Heydarpour M, Mukherjee R, Body SC, Norris RA, Lipschutz JH. Fulmer D, et al. Circulation. 2019 Oct 15;140(16):1331-1341. doi: 10.1161/CIRCULATIONAHA.119.038376. Epub 2019 Aug 7. Circulation. 2019. PMID: 31387361 Free PMC article. - Genetics, pathobiology and therapeutic opportunities of polycystic liver disease.
Olaizola P, Rodrigues PM, Caballero-Camino FJ, Izquierdo-Sanchez L, Aspichueta P, Bujanda L, Larusso NF, Drenth JPH, Perugorria MJ, Banales JM. Olaizola P, et al. Nat Rev Gastroenterol Hepatol. 2022 Sep;19(9):585-604. doi: 10.1038/s41575-022-00617-7. Epub 2022 May 13. Nat Rev Gastroenterol Hepatol. 2022. PMID: 35562534 Review.
References
- Bray SJ. Notch signalling: a simple pathway becomes complex. Nat Rev Mol Cell Biol. 2006;7:678–689. - PubMed
Publication types
MeSH terms
Substances
Grants and funding
- HHMI/Howard Hughes Medical Institute/United States
- R37 AR027883-32/AR/NIAMS NIH HHS/United States
- R37 AR027883-31/AR/NIAMS NIH HHS/United States
- R37 AR027883-30/AR/NIAMS NIH HHS/United States
- R37 AR027883/AR/NIAMS NIH HHS/United States
- R37 AR027883-33/AR/NIAMS NIH HHS/United States
LinkOut - more resources
Full Text Sources
Other Literature Sources
Molecular Biology Databases


