Histone deacetylase 9 deficiency protects against effector T cell-mediated systemic autoimmunity - PubMed (original) (raw)
Histone deacetylase 9 deficiency protects against effector T cell-mediated systemic autoimmunity
Kailin Yan et al. J Biol Chem. 2011.
Abstract
Co-repressor histone deacetylase 9 (HDAC9) plays a key role in the development and differentiation of many types of cells, including regulatory T cells. However, the biological function of HDAC9 in T effector cells is unknown. Systemic autoimmune diseases like lupus, diabetes, and rheumatoid arthritis have dysfunctional effector T cells. To determine the role of HDAC9 in systemic autoimmunity, we created MRL/lpr mice with HDAC9 deficiency that have aberrant effector T cell function. HDAC9 deficiency led to decreased lympho-proliferation, inflammation, autoantibody production, and increased survival in MRL/lpr mice. HDAC9-deficient mice manifested Th2 polarization, decreased T effector follicular cells positive for inducible co-stimulator, and activated T cells in vivo compared with HDAC9-intact MRL/lpr mice. HDAC9 deficiency also resulted in increased GATA3 and roquin and decreased BCL6 gene expression. HDAC9 deficiency was associated with increased site-specific lysine histone acetylation at H3 (H3K9, H3K14, and H3K18) globally that was localized to IL-4, roquin, and peroxisome proliferator-activated receptor-γ promoters with increased gene expression, respectively. In kidney and spleen, HDAC9 deficiency decreased inflammation and cytokine and chemokine production due to peroxisome proliferator-activated receptor γ overexpression. These findings suggest that HDAC9 acts as an epigenetic switch in effector T cell-mediated systemic autoimmunity.
Figures
FIGURE 1.
HDAC9 deficiency decreases DNT cells and activated T cells and plasma cells in MRL/lpr mice spleen. Leukocyte populations were quantified and/or phenotyped by standard cell counting and/or flow cytometry in spleen and lymph nodes WT and KO mice. A, representative flow cytometric plots used for graphs (B) for activated T cells (CD4+CD69+) and CD138 plasma cells are shown. Plots are representative of six mice from each strain. *, p < 0.05; **, p < 0.01. Other cell types analyzed in spleen and lymph nodes are detailed in
supplemental Table 2
.
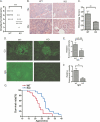
FIGURE 2.
HDAC9 deficiency decreases severity of proteinuria, kidney disease, and mortality rate in MRL/lpr mice. A, urinary proteins in MRL/lpr mice were reduced by HDAC9 deficiency. Urinary protein levels were assessed and graded semiquantitatively as described under “Experimental Procedures.” B, hematoxylin and eosin-stained sections of kidneys from WT (top) and KO (bottom) mice are shown. Each panel is from a different animal representative of 10–12 female mice examined from different groups at 20 weeks old. C, the glomerular index score of 20-week-old female WT and KO mice was determined by histological analysis of hematoxylin- and eosin-stained kidney slides according to previously known criteria by a pathologist blinded to groups; *, p < 0.05; **, p < 0.01. D, glomerular immune deposits were determined by direct immunofluorescence for complement C3 (top) and IgG (bottom) in frozen kidney sections from WT and KO mice and scored for intensity of staining in blinded fashion (E and F). G, the survival rate was determined between wild WT (n = 22) and KO (n = 20) mice by observing mice up to 40 weeks and sacrificing them when they were moribund.
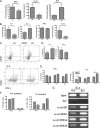
FIGURE 3.
HDAC9 regulates genes expressed in follicular and extrafollicular T effector cells in MRL/lpr mice. A, shown is real time PCR analysis of ICOS mRNA in CD4+ T cells from KO compared with WT mice. B, representative flow cytometric plots used for graph C for B220−CD4+CD44high ICOS+ T cells on splenocytes from KO are compared with WT mice. D, representative flow cytometric plots of CD4+CD44highCD62LloPSGL-1lo T cells for graph E in splenocytes from KO are compared with WT mice. F, real time PCR analysis of mRNA expression of the indicated genes associated with follicular and extrafollicular T cells from KO are compared with WT mice. G, a real time PCR analysis of roquin mRNA in CD4+ T cells from KO is compared with WT mice. H, shown is a Western blot analysis of roquin (from pooled samples of three mice from each group) that demonstrates increased expression in KO mice consistent with roquin mRNA expression; data are representative of two independent experiments. I, ChIP assays were performed in splenocytes from the KO and WT mice. Chromatin was immunoprecipitated with antibodies against total IgG, AcH3, Ac-H3K9, and AcK18. Primers flank the roquin gene, and precipitated DNA was analyzed by PCR. Non-immunoprecipitated samples served as an input control. A representative figure of two independent experiments from pooled samples of three mice in each group in each experiment is shown. J, real time PCR analysis demonstrates increased miRNA-101 in CD4+ T cells from the KO compared with WT mice. miRNA-101 expression was normalized to control miRNA-U6. Real time PCR (K) and Western blot analysis (L) of BCL6 in splenocytes demonstrates decreased expression in KO compared with WT mice. Results represent the mean ± S.E. of six animals per group. *, p < 0.05; **, p < 0.01(Student's t test).
FIGURE 4.
HDAC9 deficiency decreases T cell activation and favors Th2 polarization in vivo and in vitro in MRL/lpr mice. A, cytokine levels in serum from 20-week-old WT (n = 13) and KO (n = 13) mice were determined by ELISA. The results are expressed as the mean concentration of cytokines ± S.E. B, secreted cytokines produced by naïve CD4+ T cells from WT and KO cells stimulated with anti-CD3 and anti-CD28 mAb stimulation (n = 5 for each genotype) are shown. C, representative flow cytometric plots in graph D of the IL-4- and IFN-γ-producing CD4+ T cells from the WT and KO mice ex vivo are shown. Data are representative of two independent experiments from three pooled mice from each group. CD4+ T cells from KO mice produced increased IL-4 mRNA (E) and a higher percentage of IL-4-producing CD4+ T cells (F) in Th2-polarized condition medium compared with WT mice ex vivo. G, shown is local promoter architecture of IL-4 gene in WT and KO. A ChIP assay was performed in splenocytes from WT and KO mice. Chromatin was immunoprecipitated with antibodies against total IgG, AcH3, Ac-H3K9, and AcK18. Precipitated DNA was analyzed by PCR by primers flanking the IL-4 gene promoter. A non-immunoprecipitated sample served as an input control. A representative figure of the two independent experiments from pooled samples of three mice in each group is shown. *, p < 0.05; **, p < 0.01.
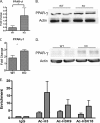
FIGURE 5.
Decreased inflammatory cytokines and chemokine production in HDAC9-deficient MRL/lpr mice is due to increased PPAR-γ expression. Real time PCR analysis of PPAR-γ mRNA expression in splenocytes (A) and kidney (C) from WT and KO mice is shown. Results represent the mean ± S.E. of six animals per group. *, p < 0.05; **, p < 0.01 (Student's t test). Shown is a Western blot analysis of PPAR-γ protein expression in splenocytes (B) and kidney (D) from WT and KO mice. E, ChIP-quantitative PCR analyses of H3Ac, H3K9Ac, and H3K18Ac modifications on PPAR-γ promoter are shown. ChIP assays were performed in splenocytes from KO and WT mice. Chromatin was immunoprecipitated with antibodies against total IgG, AcH3, Ac-H3K9, and AcK18. Quantitative ChIP was performed using SYBR Green dye using primers flanking PPAR-γ promoter. The data are the averages of three replicates, and error bars represent the S.E. Representative results of two independent experiments from pooled samples of three mice in each group are shown. Tables 1 and 2 summarize the real time PCR data of PPAR-γ dependent genes in splenocytes and kidneys in KO and WT mice. Results represent the mean ± S.E. of 6 animals per group. *, p < 0.05; **, p < 0.01 (Student's t test).
Similar articles
- Histone deacetylase (HDAC) 9: versatile biological functions and emerging roles in human cancer.
Yang C, Croteau S, Hardy P. Yang C, et al. Cell Oncol (Dordr). 2021 Oct;44(5):997-1017. doi: 10.1007/s13402-021-00626-9. Epub 2021 Jul 27. Cell Oncol (Dordr). 2021. PMID: 34318404 Free PMC article. Review. - Resetting the epigenetic histone code in the MRL-lpr/lpr mouse model of lupus by histone deacetylase inhibition.
Garcia BA, Busby SA, Shabanowitz J, Hunt DF, Mishra N. Garcia BA, et al. J Proteome Res. 2005 Nov-Dec;4(6):2032-42. doi: 10.1021/pr050188r. J Proteome Res. 2005. PMID: 16335948 - Bcl6 controls the Th2 inflammatory activity of regulatory T cells by repressing Gata3 function.
Sawant DV, Sehra S, Nguyen ET, Jadhav R, Englert K, Shinnakasu R, Hangoc G, Broxmeyer HE, Nakayama T, Perumal NB, Kaplan MH, Dent AL. Sawant DV, et al. J Immunol. 2012 Nov 15;189(10):4759-69. doi: 10.4049/jimmunol.1201794. Epub 2012 Oct 10. J Immunol. 2012. PMID: 23053511 Free PMC article. - Identifying targets for the restoration and reactivation of BRM.
Kahali B, Gramling SJ, Marquez SB, Thompson K, Lu L, Reisman D. Kahali B, et al. Oncogene. 2014 Jan 30;33(5):653-64. doi: 10.1038/onc.2012.613. Epub 2013 Mar 25. Oncogene. 2014. PMID: 23524580 - Histone Deacetylase 9: Its Role in the Pathogenesis of Diabetes and Other Chronic Diseases.
Hu S, Cho EH, Lee JY. Hu S, et al. Diabetes Metab J. 2020 Apr;44(2):234-244. doi: 10.4093/dmj.2019.0243. Diabetes Metab J. 2020. PMID: 32347025 Free PMC article. Review.
Cited by
- Histone/protein deacetylases and T-cell immune responses.
Akimova T, Beier UH, Liu Y, Wang L, Hancock WW. Akimova T, et al. Blood. 2012 Mar 15;119(11):2443-51. doi: 10.1182/blood-2011-10-292003. Epub 2012 Jan 12. Blood. 2012. PMID: 22246031 Free PMC article. Review. - Histopathological Image QTL Discovery of Immune Infiltration Variants.
Barry JD, Fagny M, Paulson JN, Aerts HJWL, Platig J, Quackenbush J. Barry JD, et al. iScience. 2018 Jul 27;5:80-89. doi: 10.1016/j.isci.2018.07.001. Epub 2018 Jul 6. iScience. 2018. PMID: 30240647 Free PMC article. - Lysine Deacetylase Substrate Selectivity: A Dynamic Ionic Interaction Specific to KDAC8.
Toro TB, Swanier JS, Bezue JA, Broussard CG, Watt TJ. Toro TB, et al. Biochemistry. 2021 Aug 24;60(33):2524-2536. doi: 10.1021/acs.biochem.1c00384. Epub 2021 Aug 6. Biochemistry. 2021. PMID: 34357750 Free PMC article. - Histone deacetylase (HDAC) 9: versatile biological functions and emerging roles in human cancer.
Yang C, Croteau S, Hardy P. Yang C, et al. Cell Oncol (Dordr). 2021 Oct;44(5):997-1017. doi: 10.1007/s13402-021-00626-9. Epub 2021 Jul 27. Cell Oncol (Dordr). 2021. PMID: 34318404 Free PMC article. Review. - Perspectives on epigenetic-based immune intervention for rheumatic diseases.
Gray SG. Gray SG. Arthritis Res Ther. 2013 Mar 14;15(2):207. doi: 10.1186/ar4167. Arthritis Res Ther. 2013. PMID: 23510070 Free PMC article. Review.
References
- Fischle W., Wang Y., Allis C. D. (2003) Nature 425, 475–479 - PubMed
- Mikkelsen T. S., Ku M., Jaffe D. B., Issac B., Lieberman E., Giannoukos G., Alvarez P., Brockman W., Kim T. K., Koche R. P., Lee W., Mendenhall E., O'Donovan A., Presser A., Russ C., Xie X., Meissner A., Wernig M., Jaenisch R., Nusbaum C., Lander E. S., Bernstein B. E. (2007) Nature 448, 553–560 - PMC - PubMed
Publication types
MeSH terms
Substances
Grants and funding
- R01-HL084592 S1/HL/NHLBI NIH HHS/United States
- R01 HL084592/HL/NHLBI NIH HHS/United States
- R01 HL084592-04/HL/NHLBI NIH HHS/United States
- R01-HL 084592/HL/NHLBI NIH HHS/United States
- R01 HL084592-04S1/HL/NHLBI NIH HHS/United States
LinkOut - more resources
Full Text Sources
Other Literature Sources
Medical
Molecular Biology Databases


