Measuring and interpreting neuronal correlations - PubMed (original) (raw)
Review
Measuring and interpreting neuronal correlations
Marlene R Cohen et al. Nat Neurosci. 2011.
Abstract
Mounting evidence suggests that understanding how the brain encodes information and performs computations will require studying the correlations between neurons. The recent advent of recording techniques such as multielectrode arrays and two-photon imaging has made it easier to measure correlations, opening the door for detailed exploration of their properties and contributions to cortical processing. However, studies have reported discrepant findings, providing a confusing picture. Here we briefly review these studies and conduct simulations to explore the influence of several experimental and physiological factors on correlation measurements. Differences in response strength, the time window over which spikes are counted, spike sorting conventions and internal states can all markedly affect measured correlations and systematically bias estimates. Given these complicating factors, we offer guidelines for interpreting correlation data and a discussion of how best to evaluate the effect of correlations on cortical processing.
Figures
Figure 1
Types of pairwise neuronal correlations. A Tuning curves for two hypothetical direction-selective neurons. Open circles show mean responses to different directions of motion, and small points show responses to individual presentations of a stimulus at a particular direction. B. Spike count or “noise” correlation (rSC) measures the correlation between fluctuations in responses to the same stimulus. Here, each point represents the response of the two neurons on one presentation of an individual stimulus. C. Signal correlation (rsignal) measures the correlation between the two cells’ mean responses to different stimuli. Each point represents the mean response to a given direction of motion. Because the responses of cell 2 increase of a range of motion directions in which the responses of cell 1 decline, signal correlation is negative.
Figure 2
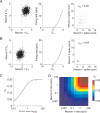
Measured correlations are small when responses are weak. A. We drew intracellular voltage “events” from a bivariate Gaussian distribution of voltage relative to threshold (Vm) such that the two neurons had the same mean voltage and the correlation coefficient between membrane potentials was 0.2 (left panel). These voltage events were converted to extracellular firing rates by passing them through a non-linearity such that the firing rate on the ith trial _fri = Vmi_1.7 (center panel). We picked this exponent so that the variance of the output rates was approximately equal to the mean. We defined the spike count on each trial to be equal to the firing rate rounded to the nearest whole spike (right panel). In the case of high mean voltages, the measured spike count correlation is close to the input correlation (rSC = 0.20). B. Same as A, for low mean Vm. When the threshold masks subthreshold events, the measured spike count correlation (rSC = 0.04) is much lower than the membrane potential correlation. C. Measured rSC as a function of firing rate, using the simulations in A and B when the two cells had the same mean rate. The circles represent the correlations and mean counts in A and B. D. Measured rSC as a function of the firing rates of each of the two cells. We simulated responses using identical methods as those in A and B, but we allowed the rates of the two neurons in a pair to differ. Correlations depend more strongly on the minimum rate in the pair than the mean.
Figure 3
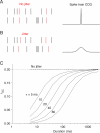
Counting spikes over short response windows can decrease measured correlations. A. We simulated correlated spike trains as a combination of independent Poisson spike trains (black spikes in the schematic on the left panel; mean = 20 sp/s) and inserted shared, synchronous spikes (red spikes, mean = 5 sp/s). Therefore, each neuron's response was the sum of independent and shared spikes (mean = 25 sp/s). When there is no jitter in the timing of the shared spikes, the cross correlogram has a sharp peak at 0 ms time lag (right panel). B. Same as A, for longer jitter times. We simulated variable timescales by jittering the timing of the correlated spikes by an amount picked from a Gaussian distribution (left panel, red spikes). This results in a cross correlogram with a peak whose width depends on the standard deviation of the Gaussian distribution (right panel). C. Measured rSC as a function of counting window for several timescales of correlation. The number next to each curve corresponds to the standard deviation of the Gaussian jitter in milliseconds.
Figure 4
Measured correlations grow slowly with the number of units that contribute to multiunit activity. We simulated single unit activity by choosing random variables from a bivariate Gaussian with covariance defined to give pairwise correlation values of 0.001-0.3. We then computed rSC between sums of these variables (as one would do when recording multiunit activity). Measured rSC increases with the number of ‘units’ contributing to the multiunit activity. The increase in magnitude is gradual, however, essentially proportional to the number of units contributing to the multiunit response. For instance, if the pairwise correlations are 0.01, multiunit clusters consisting of 10-20 units would be needed to obtain rsc values in the typical range (0.1-0.2, indicated by horizontal dotted lines).
Figure 5
Spike sorting errors can reduce the strength of measured correlations. A,B. Two ensembles of spike waveforms (red and gray) created by taking two differently shaped waveforms (thick lines) and corrupting them with multiplicative and additive noise. These waveforms are represented by the amplitude of their first two principal components (PCs); each dot indicates one waveform. Lighter shading indicates greater distance in PC space from the average waveform. C. Effect of increasingly stringent sorting thresholds (i.e. keeping only those spikes that are within a certain distance, in PC space, of the average waveform) on the measured correlation strength, for true correlation values of 0.05, 0.1, and 0.2. As the proportion of discarded spikes increases, the measured value of rsc decreases strongly. D., E. Same as A., B. for waveforms that form a tight cluster (E) and for those with a wider range of shapes (D). F. Measured correlation (rsc) between the well-isolated unit (E) and multiple random divisions of the waveforms in D. The true correlation is indicated by the filled dots to the left (0.05, 0.1 and 0.2). When the waveforms of the cell shown in D are assigned arbitrarily to two units (filled symbols), measured rsc decreases by roughly 25%, compared to the true correlation between the pair. When the waveforms are arbitrarily divided among more than two units, rsc falls further. These scenarios correspond to setting p1=0 and p2 to 0.5 (for two units created), 0.66 (for three units created), and so on, in equation 2.
Figure 6
Differences in mean rates duration predict much of the variability in rsc measurements across studies. The figure plots average rSC as a function of mean firing rate and measurement duration for 13 studies of correlations in primate visual cortex, for which these data were either provided or could be estimated from summary figures. When a range of values was reported (e.g. from different stimulus or behavioral conditions or for pairs of neurons separated by different distances), we plotted either the average or most common value, and in some cases we estimated values from summary plots. The mean firing rate accounts for 37% of the cross-study variance in mean rSC values. Differences in spike sorting were not included in this meta-analysis because sort quality is rarely quantified or discussed.
Similar articles
- Redundancy and synergy arising from pairwise correlations in neuronal ensembles.
Bezzi M, Diamond ME, Treves A. Bezzi M, et al. J Comput Neurosci. 2002 May-Jun;12(3):165-74. doi: 10.1023/a:1016531312091. J Comput Neurosci. 2002. PMID: 12142549 - Neuronal integration mechanisms have little effect on spike auto-correlations of cortical neurons.
Sakai Y. Sakai Y. Neural Netw. 2001 Nov;14(9):1145-52. doi: 10.1016/s0893-6080(01)00076-4. Neural Netw. 2001. PMID: 11718415 - Feed-Forward Propagation of Temporal and Rate Information between Cortical Populations during Coherent Activation in Engineered In Vitro Networks.
DeMarse TB, Pan L, Alagapan S, Brewer GJ, Wheeler BC. DeMarse TB, et al. Front Neural Circuits. 2016 Apr 22;10:32. doi: 10.3389/fncir.2016.00032. eCollection 2016. Front Neural Circuits. 2016. PMID: 27147977 Free PMC article. - Neural correlations, population coding and computation.
Averbeck BB, Latham PE, Pouget A. Averbeck BB, et al. Nat Rev Neurosci. 2006 May;7(5):358-66. doi: 10.1038/nrn1888. Nat Rev Neurosci. 2006. PMID: 16760916 Review. - Intracellular and computational evidence for a dominant role of internal network activity in cortical computations.
Destexhe A. Destexhe A. Curr Opin Neurobiol. 2011 Oct;21(5):717-25. doi: 10.1016/j.conb.2011.06.002. Epub 2011 Jun 27. Curr Opin Neurobiol. 2011. PMID: 21715156 Review.
Cited by
- Temporally precise population coding of dynamic sounds by auditory cortex.
Downer JD, Bigelow J, Runfeldt MJ, Malone BJ. Downer JD, et al. J Neurophysiol. 2021 Jul 1;126(1):148-169. doi: 10.1152/jn.00709.2020. Epub 2021 Jun 2. J Neurophysiol. 2021. PMID: 34077273 Free PMC article. - Functional heterogeneity in neighboring neurons of cat primary visual cortex in response to both artificial and natural stimuli.
Martin KA, Schröder S. Martin KA, et al. J Neurosci. 2013 Apr 24;33(17):7325-44. doi: 10.1523/JNEUROSCI.4071-12.2013. J Neurosci. 2013. PMID: 23616540 Free PMC article. - Retrosplenial inputs drive visual representations in the medial entorhinal cortex.
Dubanet O, Higley MJ. Dubanet O, et al. Cell Rep. 2024 Jul 23;43(7):114470. doi: 10.1016/j.celrep.2024.114470. Epub 2024 Jul 9. Cell Rep. 2024. PMID: 38985682 Free PMC article. - Odor representations in olfactory cortex: distributed rate coding and decorrelated population activity.
Miura K, Mainen ZF, Uchida N. Miura K, et al. Neuron. 2012 Jun 21;74(6):1087-98. doi: 10.1016/j.neuron.2012.04.021. Neuron. 2012. PMID: 22726838 Free PMC article. - Correlated structure of neuronal firing in macaque visual cortex limits information for binocular depth discrimination.
Smith JET, Parker AJ. Smith JET, et al. J Neurophysiol. 2021 Jul 1;126(1):275-303. doi: 10.1152/jn.00667.2020. Epub 2021 May 12. J Neurophysiol. 2021. PMID: 33978495 Free PMC article.
References
- Tolhurst DJ, Movshon JA, Dean AF. The statistical reliability of signals in single neurons in cat and monkey visual cortex. Vision Res. 1983;23:775–785. - PubMed
- Abbott LF, Dayan P. The effect of correlated variability on the accuracy of a population code. Neural Comput. 1999;11:91–101. - PubMed
- Averbeck BB, Latham PE, Pouget A. Neural correlations, population coding and computation. Nat Rev Neurosci. 2006;7:358–366. - PubMed
Publication types
MeSH terms
LinkOut - more resources
Full Text Sources
Other Literature Sources


