Chloroquine treatment of ARPE-19 cells leads to lysosome dilation and intracellular lipid accumulation: possible implications of lysosomal dysfunction in macular degeneration - PubMed (original) (raw)
Chloroquine treatment of ARPE-19 cells leads to lysosome dilation and intracellular lipid accumulation: possible implications of lysosomal dysfunction in macular degeneration
Patrick M Chen et al. Cell Biosci. 2011.
Abstract
Background: Age-related macular degeneration (AMD) is the leading cause of vision loss in elderly people over 60. The pathogenesis is still unclear. It has been suggested that lysosomal stress may lead to drusen formation, a biomarker of AMD. In this study, ARPE-19 cells were treated with chloroquine to inhibit lysosomal function.
Results: Chloroquine-treated ARPE-19 cells demonstrate a marked increase in vacuolation and dense intracellular debris. These are identified as chloroquine-dilated lysosomes and lipid bodies with LAMP-2 and LipidTOX co-localization, respectively. Dilation is an indicator of lysosomal dysfunction. Chloroquine disrupts uptake of exogenously applied rhodamine-labeled dextran by these cells. This suggests a disruption in the phagocytic pathway. The increase in LAMP protein levels, as assessed by Western blots, suggests the possible involvement in autophagy. Oxidative stress with H2O2 does not induce vacuolation or lipid accumulation.
Conclusion: These findings suggest a possible role for lysosomes in AMD. Chloroquine treatment of RPE cells may provide insights into the cellular mechanisms underlying AMD.
Figures
Figure 1
Cell Viability Assay. MTT assay shows chloroquine toxicity is both time and dose dependent. Chloroquine concentrations of 10-30 μg/ml (p < 0.05) do not significantly affect cell viability.
Figure 2
Cytoplasmic Changes with Chloroquine in ARPE-19. Phase contrast microscopy of ARPE-19 with 0 (A), 10 (B), 20 (C), 40 (D), 80 (E) μg/ml chloroquine. Chloroquine treatment causes membrane-enclosed vacuoles (red arrows) and membranous dense bodies (blue arrows). ARPE treated with high chloroquine dosage show signs of cell death. Bar size = 25 microns.
Figure 3
Co-localization of LAMP-2 and LipidTOX. (A-D) Control ARPE-19. (E-H) 20 μg/ml chloroquine-treated ARPE-19. Control phase contrast (A) shows no vacuolation and LAMP-2 (B, green), and LipidTOX(C, red) staining is observed throughout cell. D is fluorescent overlay. Chloroquine-treated cell in phase contrast (E) shows intense vacuolation (white arrows). These vacuoles co-localize with LAMP-2 staining (F, corresponding white arrows). Chloroquine treatment also induces dense body formation (E, yellow arrows). Dense formations co-localize with neutral lipid (G, corresponding yellow arrows). Overlay (H) shows no overlap between lipids and vacuoles. Bar size = 25 microns.
Figure 4
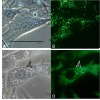
Co-localization of LAMP-1 in NIH/3T3. NIH/3T3 cells show a similar pattern of vacuole formation with treatment of chloroquine. Phase contrast and corresponding LAMP-1 co-localization of 25 μg/ml chloroquine-treated cells (C, D) show vacuolation of LAMP-1, when compared with control (A, B). The arrows in C and D note that the borders of the vacuoles correspond with LAMP-1 protein. Bar size = 25 microns.
Figure 5
Chloroquine Effect on ARPE-19 Golgi and Mitochondria. (A-D) Mitochondria co-localization in (A-B) control and (C-D) 20 μg/ml-treated ARPE-19. There is no difference in MitoTracker staining (red) intensity, shape or localization between control (B) and treatment (D). Similarly, there were no noticeable changes in Golgi apparatus (E-H). Golgi co-localization of control (E-F) and 20 μg/ml chloroquine treatments. Golgi is stained with Golgin-97 antibody staining (green). Bar size = 25 microns.
Figure 6
Phagocytic Activity and LAMP Protein. (A) Comparisons of LAMP-1 and LAMP-2 protein levels at different concentrations of chloroquine. Protein levels measured in ARPE-19 by Western blot with beta-actin as loading control. Western shows marked qualitative increase in LAMP 1-2 band size between control and 10 μg/ml chloroquine treatment, while loaded control is constant. (B) There is a significant increase in LAMP-1 and 2 (p < 0.05) at 10 μg/ml with overall upregulation trend response to chloroquine treatment. Immunoblots (n = 6) were scanned, and densitometry was performed on bands with ImageJ (NIH, Bethesda MD). Relative band density measurement was repeated several times to ensure maximum and minimum values.
Figure 7
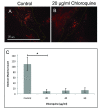
Phagocytic Activity Measured by Dextran Uptake. (A-B) Immunofluorescence of exogenous rhodamine-labeled dextran (red) uptake with ImageJ markings (crosshairs) of counted dextran maximas. 20 μg/ml chloroquine-treated cells at 24 hours (B) showed striking decrease in fluorescent dextran uptake when compared to control (A). (C) Quantization of dextran uptake between control and chloroquine-treated ARPE-19. There is a significant (p < 0.05) decrease in relative dextran uptake in individual sampled ARPE-19 cells between control and chloroquine-treated cells. Quantitation was performed by using ImageJ, isolating cells of relative same size (~20-25 microns), and then calculating florescent maximas (tolerance = 20, based on control). Maximas were averaged and standard t-test was performed (n = 10).
Figure 8
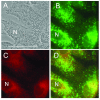
Oxidative Stress Test. (A) phase contrast, (B) LAMP-2 and (C) LipidTOX staining of 10 mM hydrogen peroxide-treated ARPE-19. (D) Overlay showing co-localization of neutral lipid and LAMP-2. There are no differences in cell cytoplasm (vacuoles, lipids) in phase or fluorescence between control (Fig 2 A-D) and hydrogen peroxide treatment.
Figure 9
Possible LAMP-2/Lysosomal Inhibition Model of Pathogenesis of AMD. An unknown cause results in loss of the protective glycocalyx of LAMP-2. Proteolysis of LAMP-2 occurs. Loss of LAMP-2 results in either 1) A pH shift and loss of acidity of lysosome, 2) dynein no longer moving late phagosome to microtubule sorting center near Golgi for fusion with lysosome or 3) perturbation of M6PR/Rab recycling such that M6PR/Rab7 does not tag late endosomes. The loss of functionality of M6PR/Rab7 results in a lack of phagosome lysosome-fusion. Any of these results in loss of the lysosome's ability to degrade intra- and extracellular material. Subsequently, undegraded material is oxidized, turning to lipofuscin. Ultimately, the combination of oxidative stress, Fe+ accumulation, senile mitochondria and decrease in ATP results in inefficient turnover of organelles and increased inhibition of lysosomes. RPE death triggers photoreceptor and macula death.
Similar articles
- Protective effect of zinc against A2E-induced toxicity in ARPE-19 cells: Possible involvement of lysosomal acidification.
Choi JA, Seo BR, Koh JY, Yoon YH. Choi JA, et al. Heliyon. 2024 Oct 11;10(21):e39100. doi: 10.1016/j.heliyon.2024.e39100. eCollection 2024 Nov 15. Heliyon. 2024. PMID: 39524844 Free PMC article. - Autophagy of iron-binding proteins may contribute to the oxidative stress resistance of ARPE-19 cells.
Karlsson M, Frennesson C, Gustafsson T, Brunk UT, Nilsson SE, Kurz T. Karlsson M, et al. Exp Eye Res. 2013 Nov;116:359-65. Exp Eye Res. 2013. PMID: 24416768 - NLRP3 inflammasome activation in retinal pigment epithelial cells by lysosomal destabilization: implications for age-related macular degeneration.
Tseng WA, Thein T, Kinnunen K, Lashkari K, Gregory MS, D'Amore PA, Ksander BR. Tseng WA, et al. Invest Ophthalmol Vis Sci. 2013 Jan 7;54(1):110-20. doi: 10.1167/iovs.12-10655. Invest Ophthalmol Vis Sci. 2013. PMID: 23221073 Free PMC article. - Heat shock proteins as gatekeepers of proteolytic pathways-Implications for age-related macular degeneration (AMD).
Kaarniranta K, Salminen A, Eskelinen EL, Kopitz J. Kaarniranta K, et al. Ageing Res Rev. 2009 Apr;8(2):128-39. doi: 10.1016/j.arr.2009.01.001. Ageing Res Rev. 2009. PMID: 19274853 Review. - Defects in retinal pigment epithelial cell proteolysis and the pathology associated with age-related macular degeneration.
Ferrington DA, Sinha D, Kaarniranta K. Ferrington DA, et al. Prog Retin Eye Res. 2016 Mar;51:69-89. doi: 10.1016/j.preteyeres.2015.09.002. Epub 2015 Sep 4. Prog Retin Eye Res. 2016. PMID: 26344735 Free PMC article. Review.
Cited by
- What makes (hydroxy)chloroquine ineffective against COVID-19: insights from cell biology.
Altulea D, Maassen S, Baranov MV, van den Bogaart G. Altulea D, et al. J Mol Cell Biol. 2021 Jul 6;13(3):175-184. doi: 10.1093/jmcb/mjab016. J Mol Cell Biol. 2021. PMID: 33693723 Free PMC article. Review. - An Indocyanine Green-Based Nanoprobe for In Vivo Detection of Cellular Senescence.
Baker AG, Hartono M, Ou HL, Popov AB, Brown EL, Joseph J, Golinska M, González-Gualda E, Macias D, Ge J, Denholm M, Morsli S, Sanghera C, Else TR, Greer HF, Vernet A, Bohndiek SE, Muñoz-Espín D, Fruk L. Baker AG, et al. Angew Chem Int Ed Engl. 2024 Jun 17;63(25):e202404885. doi: 10.1002/anie.202404885. Epub 2024 May 16. Angew Chem Int Ed Engl. 2024. PMID: 38622059 Free PMC article. - The role of autophagy in regulating metabolism in the tumor microenvironment.
Zhang P, Cheng S, Sheng X, Dai H, He K, Du Y. Zhang P, et al. Genes Dis. 2021 Dec 3;10(2):447-456. doi: 10.1016/j.gendis.2021.10.010. eCollection 2023 Mar. Genes Dis. 2021. PMID: 37223500 Free PMC article. Review. - Breast tumor-on-chip models: From disease modeling to personalized drug screening.
Subia B, Dahiya UR, Mishra S, Ayache J, Casquillas GV, Caballero D, Reis RL, Kundu SC. Subia B, et al. J Control Release. 2021 Mar 10;331:103-120. doi: 10.1016/j.jconrel.2020.12.057. Epub 2021 Jan 6. J Control Release. 2021. PMID: 33417986 Free PMC article. Review. - Use of 3D Human Liver Organoids to Predict Drug-Induced Phospholipidosis.
Lee JY, Han HJ, Lee SJ, Cho EH, Lee HB, Seok JH, Lim HS, Son WC. Lee JY, et al. Int J Mol Sci. 2020 Apr 23;21(8):2982. doi: 10.3390/ijms21082982. Int J Mol Sci. 2020. PMID: 32340283 Free PMC article.
References
LinkOut - more resources
Full Text Sources
Miscellaneous


