An Atg13 protein-mediated self-association of the Atg1 protein kinase is important for the induction of autophagy - PubMed (original) (raw)
An Atg13 protein-mediated self-association of the Atg1 protein kinase is important for the induction of autophagy
Yuh-Ying Yeh et al. J Biol Chem. 2011.
Abstract
Autophagy pathways in eukaryotic cells mediate the turnover of a diverse set of cytoplasmic components, including damaged organelles and abnormal protein aggregates. Autophagy-mediated degradation is highly regulated, and defects in these pathways have been linked to a number of human disorders. The Atg1 protein kinase appears to be a key site of this control and is targeted by multiple signaling pathways to ensure the appropriate autophagic response to changing environmental conditions. Despite the importance of this kinase, relatively little is known about the molecular details of Atg1 activation. In this study we show that Atg13, an evolutionarily conserved regulator of Atg1, promotes the formation of a specific Atg1 self-interaction in the budding yeast, Saccharomyces cerevisiae. The appearance of this Atg1-Atg1 complex is correlated with the induction of autophagy, and conditions that disrupt this complex result in diminished levels of both autophagy and Atg1 kinase activity. Moreover, the addition of a heterologous dimerization domain to Atg1 resulted in elevated kinase activity both in vivo and in vitro. The formation of this complex appears to be an important prerequisite for the subsequent autophosphorylation of Thr-226 in the Atg1 activation loop. Previous work indicates that this modification is necessary and perhaps sufficient for Atg1 kinase activity. Interestingly, this Atg1 self-association does not require Atg17, suggesting that this second conserved regulator might activate Atg1 in a manner mechanistically distinct from that of Atg13. In all, this work suggests a model whereby this self-association stimulates the autophosphorylation of Atg1 within its activation loop.
Figures
FIGURE 1.
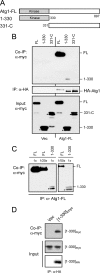
Atg1 participates in a self-interaction in vivo. A, a schematic shows the different Atg1 constructs used in these binding studies. Atg1-FL refers to the full-length Atg1 protein, and the shaded region indicates the N-terminal protein kinase domain. B, the full-length Atg1 exhibited a robust self-interaction. Extracts were prepared from cells expressing the indicated myc epitope-tagged Atg1 fragments together with an HA-tagged full-length Atg1. The HA3-Atg1 was precipitated on an α-HA affinity resin, and the relative amounts of the associated Atg1 fragments were assessed by Western blotting with an α-myc antibody. The protein bands indicated by the closed circles are degradation products present in the samples. Vec, vector. C, the protein kinase domain of Atg1 exhibited a weak interaction with the full-length Atg1. The interaction between two full-length Atg1 proteins or the 1–330 fragment and a full-length Atg1 was assessed with a co-immunoprecipitation assay as described above. The full-length HA-tagged Atg1 was precipitated in each case, and the relative amount of the associated full-length Atg1 or 1–330 fragment was assessed by Western blotting with an α-myc antibody. To assess the relative strengths of the interactions, 1/20× and 1/50× amounts of the immunoprecipitation mixture from the extracts containing two full-length Atg1 proteins were loaded onto the gel. FL refers to the full-length Atg1. The positions of the full-length Atg1 and the 1–330 fragment of Atg1 are indicated. D, an interaction was observed between two 1–330 fragments of Atg1. The HA-tagged fragment was precipitated on an α-HA affinity resin, and the amount of the associated myc-tagged fragment was assessed by Western blotting with an α-myc antibody.
FIGURE 2.
The level of the Atg1-Atg1 complex was elevated in cells undergoing autophagy. Log phase (L) or rapamycin-treated (R) cells were incubated with the cross-linking agent, dithiobis[succinimidylpropionate], for 30 min as described under “Experimental Procedures.” The cells expressed the full-length Atg1-myc3 with or without the full-length HA3-Atg1, as indicated. Cell extracts were prepared, and the HA3-Atg1 was precipitated on an α-HA affinity resin. The relative amount of associated Atg1-myc3 was then assessed by Western blotting as described under “Experimental Procedures.”
FIGURE 3.
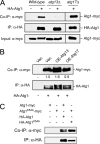
Atg1 self-association required the presence of the Atg13 protein. A, the level of the Atg1-Atg1 complex was greatly diminished in _atg13_Δ cell extracts. The relative level of the Atg1 self-interaction was assessed in the indicated strains expressing the full-length Atg1-myc3 with or without the full-length HA3-Atg1. The HA3-Atg1 was precipitated on an α-HA affinity resin, and the relative amount of the associated Atg1-myc3 was assessed by Western blotting with an α-myc antibody. B, the relative level of the Atg1 self-association was elevated in cells overexpressing (OE) Atg13. The values shown below the top panel indicate the relative level of Atg1-myc protein present in the co-immunoprecipitation reaction. The Western blot signal was quantified with the ImageJ program and normalized to that present in the vector (Vec) control lane. C, the kinase-defective Atg1K54A variant exhibited a normal self-interaction. The Atg1 self-association was examined in cells expressing myc- and HA-tagged versions of either the wild-type Atg1 or the kinase-defective variant, Atg1K54A, as indicated.
FIGURE 4.
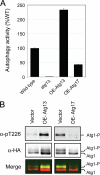
The overexpression of Atg17 resulted in diminished levels of both autophagy and Atg1 kinase activity. A, autophagy levels were reduced in cells overexpressing Atg17. Autophagy was assessed with the Pho8Δ60-based alkaline phosphatase assay as described under “Experimental Procedures.” The graph shows the relative autophagy activity present in the indicated strains; the wild type is assigned the value of 100%. B, the levels of Atg1 autophosphorylation at Thr-226 were reduced in cells overexpressing (OE) Atg17. The relative level of Thr-226 phosphorylation in Atg1 was assessed in cells overexpressing either Atg13 or Atg17 by Western blotting with an α-Thr(P)-226 phosphospecific antibody (27). The levels of Thr-226 phosphorylation and total Atg1 protein were determined with a LICOR Biosciences Odyssey infrared imaging system as described under “Experimental Procedures.” The bottom panel shows the merged image for the α-Thr(P)-226 and α-HA panels where the former is false-colored green, and the latter is red. Note that different exposure times were used to illustrate the relevant effects of Atg13 and Atg17 overexpression. Atg1-P indicates the position of an autophosphorylated form of Atg1 that migrates anomalously on SDS-polyacrylamide gels (24, 28).
FIGURE 5.
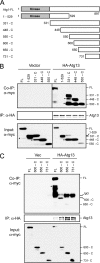
A C-terminal domain of Atg1 was necessary and sufficient for the interaction with Atg13. A, a schematic depicts the Atg1 fragments used for the mapping analysis described here. B and C, Atg13 interacted specifically with C-terminal fragments of Atg1. HA-Atg13 was immunoprecipitated from yeast cells that also expressed the indicated myc-tagged fragments of Atg1. The relative levels of the Atg1 fragments present in the immunoprecipitates were assessed by Western blotting with an α-myc antibody. The closed circles indicate degradation products present in the samples. FL, full-length. Vec, vector.
FIGURE 6.
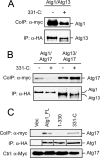
The overexpression of the 331-C fragment of Atg1 specifically disrupted the interaction between Atg13 and Atg1. A, overexpression of the 331-C fragment of Atg1 disrupted the interaction between Atg13 and Atg1. The 331-C fragment of Atg1 was overexpressed in cells containing an HA-tagged Atg13 and a myc-tagged Atg1. Atg13 was collected on an α-HA affinity resin, and the amount of the associated Atg1 was assessed by Western blotting with an α-myc antibody. B, overexpression of the 331-C fragment of Atg1 did not affect the interaction between Atg13 and Atg17. The 331-C fragment of Atg1 was overexpressed in cells containing a myc-tagged Atg17 and an HA-tagged version of either Atg1 or Atg13. The latter HA-tagged proteins were collected on an α-HA affinity resin, and the amount of the associated Atg17 was assessed by Western blotting with an α-myc antibody. C, Atg17 exhibited an interaction with the C-terminal 331-C domain of Atg1. HA-tagged versions of the indicated fragments of Atg1 (full-length, 1–330, and 331-C) were co-expressed in cells with a myc-tagged Atg17. The HA-tagged fragments were collected on an α-HA affinity resin, and the amount of the associated Atg17 was assessed by Western blotting with an α-myc antibody. Note that the Western blot bands corresponding to the different HA-tagged fragments of Atg1 were spliced together to facilitate the comparison of protein levels.
FIGURE 7.
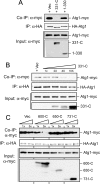
Overexpression of TID-containing fragments of Atg1 led to a disruption of the Atg1 self-interaction. A, overexpression of the 331-C fragment of Atg1 resulted in a diminished level of the Atg1-Atg1 complex. The 1–330 and 331-C fragments of Atg1 were overexpressed in cells that were also expressing HA- and myc-tagged versions of the full-length Atg1. The Atg1 self-interaction was detected by Western blotting for the presence of the Atg1-myc protein in immunoprecipitates that had been collected on an α-HA affinity resin. B, increasing amounts of the 331-C fragment of Atg1 led to a correspondingly greater disruption of the Atg1 self-interaction. C, the 600-C fragment was the minimal Atg1 domain capable of disrupting the Atg1 self-interaction. The effects of overexpressing the indicated fragments of Atg1 on the Atg1 self-interaction were assessed as described above in A.
FIGURE 8.
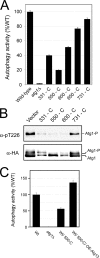
Overexpression of TID-containing fragments of Atg1 resulted in diminished levels of both autophagy and Atg1 protein kinase activity. A, overexpression of Atg1 fragments that contained the TID led to an inhibition of autophagy activity. Autophagy activity was assessed in the wild-type strain, TN125, overexpressing the indicated fragments of Atg1 with the Pho8Δ60-based alkaline phosphatase assay. The graph shows the relative autophagy activity present in the indicated strains after normalization to the wild type. B, the levels of Atg1 autophosphorylation at Thr-226 were reduced in cells overexpressing TID-containing fragments of Atg1. The relative level of Thr-226 phosphorylation was assessed by Western blotting with an α-Thr(P)-226 phosphospecific antibody (27). The levels of Thr-226 phosphorylation and total Atg1 protein were determined with a LICOR Biosciences Odyssey infrared imaging system as described under “Experimental Procedures.” Atg1-P indicates the position of an autophosphorylated form of Atg1 that migrates anomalously on SDS-polyacrylamide gels (24, 28). C, the inhibition of autophagy associated with overexpression of the 550-C fragment of Atg1 was suppressed by the presence of excess Atg13. Autophagy activity was assessed in the indicated cells with the Pho8Δ60-based alkaline phosphatase assay. The graph shows the relative autophagy activity present in the indicated strains after normalization to the wild type. Wt refers to the wild-type yeast strain, TN125.
FIGURE 9.
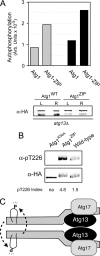
The addition of a heterologous dimerization domain resulted in elevated Atg1 protein kinase activity in an _atg13_Δ strain. A, the presence of a leucine zipper dimerization motif led to increased Atg1 autophosphorylation in vitro. Atg1 and Atg1-ZIP were immunoprecipitated from either log phase (gray bars) or rapamycin-treated (black bars) cells, and an in vitro autophosphorylation assay was carried out with [γ-32P] ATP as described under “Experimental Procedures.” The reaction products were then run out on an SDS-polyacrylamide gel, and the amount of radiolabel incorporated into Atg1 was assessed by phosphorimaging. The lower panel indicates the relative Atg1 protein amount present in the kinase reactions. L, log phase; R, rapamycin-treated. B, the presence of the dimerization domain resulted in an elevated level of Atg1 autophosphorylation at Thr-226 in vivo. The relative level of autophosphorylation at Thr-226 on the indicated proteins was assessed by Western blotting with the α- Thr(P)-226 phosphospecific antibody. The cells were treated for 1 h with 200 ng/ml rapamycin before analysis. The levels of Thr-226 phosphorylation and total Atg1 protein were determined with a LICOR Biosciences Odyssey infrared imaging system. The Thr(P)-226 Index refers to the α-Thr(P)-226 signal after normalization for the amount of Atg1 protein present. C, shown is a model for the activation of Atg1. Atg13 binds to a C-terminal domain of Atg1 and to Atg17. This interaction with Atg13 promotes an Atg1 self-association that results in the subsequent autophosphorylation of Thr-226 in the activation loop; an intermolecular, or in trans, reaction is shown. Note that the relative stoichiometry of the different proteins in this complex has not yet been determined. See “Discussion” for further details.
Similar articles
- Autophosphorylation within the Atg1 activation loop is required for both kinase activity and the induction of autophagy in Saccharomyces cerevisiae.
Yeh YY, Wrasman K, Herman PK. Yeh YY, et al. Genetics. 2010 Jul;185(3):871-82. doi: 10.1534/genetics.110.116566. Epub 2010 May 3. Genetics. 2010. PMID: 20439775 Free PMC article. - The Intrinsically Disordered Protein Atg13 Mediates Supramolecular Assembly of Autophagy Initiation Complexes.
Yamamoto H, Fujioka Y, Suzuki SW, Noshiro D, Suzuki H, Kondo-Kakuta C, Kimura Y, Hirano H, Ando T, Noda NN, Ohsumi Y. Yamamoto H, et al. Dev Cell. 2016 Jul 11;38(1):86-99. doi: 10.1016/j.devcel.2016.06.015. Dev Cell. 2016. PMID: 27404361 - Assembly and dynamics of the autophagy-initiating Atg1 complex.
Stjepanovic G, Davies CW, Stanley RE, Ragusa MJ, Kim DJ, Hurley JH. Stjepanovic G, et al. Proc Natl Acad Sci U S A. 2014 Sep 2;111(35):12793-8. doi: 10.1073/pnas.1407214111. Epub 2014 Aug 19. Proc Natl Acad Sci U S A. 2014. PMID: 25139988 Free PMC article. - ATG13: just a companion, or an executor of the autophagic program?
Alers S, Wesselborg S, Stork B. Alers S, et al. Autophagy. 2014 Jun;10(6):944-56. doi: 10.4161/auto.28987. Autophagy. 2014. PMID: 24879146 Free PMC article. Review. - Recruitment and Activation of the ULK1/Atg1 Kinase Complex in Selective Autophagy.
Turco E, Fracchiolla D, Martens S. Turco E, et al. J Mol Biol. 2020 Jan 3;432(1):123-134. doi: 10.1016/j.jmb.2019.07.027. Epub 2019 Jul 25. J Mol Biol. 2020. PMID: 31351898 Free PMC article. Review.
Cited by
- cAMP-Protein kinase A and stress-activated MAP kinase signaling mediate transcriptional control of autophagy in fission yeast during glucose limitation or starvation.
Pérez-Díaz AJ, Vázquez-Marín B, Vicente-Soler J, Prieto-Ruiz F, Soto T, Franco A, Cansado J, Madrid M. Pérez-Díaz AJ, et al. Autophagy. 2023 Apr;19(4):1311-1331. doi: 10.1080/15548627.2022.2125204. Epub 2022 Sep 26. Autophagy. 2023. PMID: 36107819 Free PMC article. - The dynamic Atg13-free conformation of the Atg1 EAT domain is required for phagophore expansion.
Lin MG, Schöneberg J, Davies CW, Ren X, Hurley JH. Lin MG, et al. Mol Biol Cell. 2018 May 15;29(10):1228-1237. doi: 10.1091/mbc.E17-04-0258. Epub 2018 Mar 22. Mol Biol Cell. 2018. PMID: 29540529 Free PMC article. - Identification of the autophagy pathway in a mollusk bivalve, Crassostrea gigas.
Picot S, Faury N, Arzul I, Chollet B, Renault T, Morga B. Picot S, et al. Autophagy. 2020 Nov;16(11):2017-2035. doi: 10.1080/15548627.2020.1713643. Epub 2020 Jan 22. Autophagy. 2020. PMID: 31965890 Free PMC article. - Atomistic autophagy: the structures of cellular self-digestion.
Hurley JH, Schulman BA. Hurley JH, et al. Cell. 2014 Apr 10;157(2):300-311. doi: 10.1016/j.cell.2014.01.070. Cell. 2014. PMID: 24725401 Free PMC article. Review. - Binding of the Atg1/ULK1 kinase to the ubiquitin-like protein Atg8 regulates autophagy.
Kraft C, Kijanska M, Kalie E, Siergiejuk E, Lee SS, Semplicio G, Stoffel I, Brezovich A, Verma M, Hansmann I, Ammerer G, Hofmann K, Tooze S, Peter M. Kraft C, et al. EMBO J. 2012 Sep 12;31(18):3691-703. doi: 10.1038/emboj.2012.225. Epub 2012 Aug 10. EMBO J. 2012. PMID: 22885598 Free PMC article.
References
- Klionsky D. J. (2007) Nat. Rev. Mol. Cell Biol. 8, 931–937 - PubMed
- Nakatogawa H., Suzuki K., Kamada Y., Ohsumi Y. (2009) Nat. Rev. Mol. Cell Biol. 10, 458–467 - PubMed
- Todde V., Veenhuis M., van der Klei I. J. (2009) Biochim. Biophys. Acta 1792, 3–13 - PubMed
- Mizushima N. (2007) Genes Dev. 21, 2861–2873 - PubMed
- Mizushima N., Klionsky D. J. (2007) Annu. Rev. Nutr. 27, 19–40 - PubMed
Publication types
MeSH terms
Substances
LinkOut - more resources
Full Text Sources
Molecular Biology Databases
