HIF induces human embryonic stem cell markers in cancer cells - PubMed (original) (raw)
. 2011 Jul 1;71(13):4640-52.
doi: 10.1158/0008-5472.CAN-10-3320. Epub 2011 Jun 28.
Zhan Zhang, Wenyu Zhou, Amy J Wang, John M Heddleston, Claudia M A Pinna, Alexis Hubaud, Bradford Stadler, Michael Choi, Merav Bar, Muneesh Tewari, Alvin Liu, Robert Vessella, Robert Rostomily, Donald Born, Marshall Horwitz, Carol Ware, C Anthony Blau, Michele A Cleary, Jeremy N Rich, Hannele Ruohola-Baker
Affiliations
- PMID: 21712410
- PMCID: PMC3129496
- DOI: 10.1158/0008-5472.CAN-10-3320
HIF induces human embryonic stem cell markers in cancer cells
Julie Mathieu et al. Cancer Res. 2011.
Abstract
Low oxygen levels have been shown to promote self-renewal in many stem cells. In tumors, hypoxia is associated with aggressive disease course and poor clinical outcomes. Furthermore, many aggressive tumors have been shown to display gene expression signatures characteristic of human embryonic stem cells (hESC). We now tested whether hypoxia might be responsible for the hESC signature observed in aggressive tumors. We show that hypoxia, through hypoxia-inducible factor (HIF), can induce an hESC-like transcriptional program, including the induced pluripotent stem cell (iPSC) inducers, OCT4, NANOG, SOX2, KLF4, cMYC, and microRNA-302 in 11 cancer cell lines (from prostate, brain, kidney, cervix, lung, colon, liver, and breast tumors). Furthermore, nondegradable forms of HIFα, combined with the traditional iPSC inducers, are highly efficient in generating A549 iPSC-like colonies that have high tumorigenic capacity. To test potential correlation between iPSC inducers and HIF expression in primary tumors, we analyzed primary prostate tumors and found a significant correlation between NANOG-, OCT4-, and HIF1α-positive regions. Furthermore, NANOG and OCT4 expressions positively correlated with increased prostate tumor Gleason score. In primary glioma-derived CD133 negative cells, hypoxia was able to induce neurospheres and hESC markers. Together, these findings suggest that HIF targets may act as key inducers of a dynamic state of stemness in pathologic conditions.
©2011 AACR.
Figures
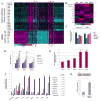
Figure 1. Hypoxia induces hESC markers among cancer cells
(A) mRNA profiling of hESC and hypoxic cancer cell lines (2% O2 24h) shown in a heatmap representation of gene expression changes. The color bar represents log10 expression ratio −0.7 (teal) to +0.7 (magenta) (P<0.01 in at least 9 experiments). Outlined in dotted red are the overlap between these two profiling experiments. Cluster #5 (common up-regulated genes) contains OCT4 and other stem cell markers. (B) iPSC inducers are upregulated in cancer cells in response to hypoxia. The color bar represents log10 expression ratio (hypoxia relative to normoxia) −0.6 (teal) to +0.6 (magenta). (C) qPCR validation of OCT4 expression in various cancer cell lines after 24h in hypoxia (2% O2). (D) Stem cell markers are up-regulated by hypoxia over time in ME180 cells (qPCR analysis). (E) OCT4 protein is up-regulated by hypoxia in ME180 cells (flow cytometry analysis). Incubation with the secondary antibody (2nd AB) alone was used as a negative control. (F) hESC enriched miRNAs are up-regulated by hypoxia treatment (24h in 2% O2) in multiple tumor cell lines (qPCR analysis). p values were calculated using paired t-test to measure the difference between the microRNA level under hypoxia and normoxia conditions in all cell lines. (G) The miR-302 promoter is responsive to over-expression of non-degradable forms of HIFα in HeLa cells.
Figure 2. Dependence of HIF for hypoxia-induced expression of stem cell markers
(A) Overexpression of non-degradable (nd) forms of HIFα under normoxia was assessed by Western blot analysis in ME180 cells 3 days after transfection with either an empty vector control (EV) or ndHIF1α or ndHIF2α. (B) The HIF-sensor containing 6 repeats of the HIF binding site (HBR) upstream of a minimal promoter (mP) and the yellow fluorescence protein (YFP) coding gene (upper panel) is upregulated by overexpression of ndHIF1α or ndHIF2α. (C) OCT4 promoter-GFP reporter is activated in ME180 Oct4-GFP and U251 Oct4-GFP cells two days after transfection with ndHIF1α and ndHIF2α but not with EV. Percentage of GFP-positive cells are indicated. (D) Expression of stem cell markers in renal carcinoma cells expressing either no functional VHL (qPCR; 786-0-pBABE = 786) or a functional VHL (786-0-pBABE-VHL = 786+VHL). (E) Oct4-GFP is induced in 786 but not in 786+VHL cells after transfection with ndHIF1α or ndHIF2α. Percentages of GFP-positive cells are indicated. (F–G) Hypoxia-induced expression of OCT4, NANOG and SOX2 is dependent on both HIF1α and HIF2α in ME180 (F) and HCT116 cells (G). The cells were transfected with siRNA directed against HIF1α, HIF2α or HIFβ. 24h later, the cells were cultured in normoxia or hypoxia (2% O2) for 24h before qPCR (F) or microarray (G) analysis. The color bar represents log10 expression ratio (hypoxia vs. normoxia) −0.3 (teal) to +0.3 (magenta) (G).
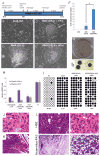
Figure 3. Overexpression of OCT4, SOX2, NANOG, LIN28 and HIFs in lung cancer cells
(A) Experimental flowchart depicting the generation of iPS-like cells from A549 lung adenocarcinoma cells. (B–C) Bright field images of A549 cells infected with a pBABE empty vector control (EV, B) and of a colony obtained 12 days after infection of A549 with Oct4/Sox2, Lin28/Nanog (OSLN), ndHIF1α and ndHIF2α (C). (D–E) Bright field images of picked colonies amplified on feeders obtained from A549 infected with OSLN (D) and with OSLN+ndHIFs (E). (F) HIF1 overepression enhances the induction of iPSC-like colonies. Colonies were counted on day 20 after lentiviral transduction. (G) Alkaline phosphatase staining of A549(OSLN+HIFs) colonies grown on feeders. (H) RT-qPCR analysis of endogenous NANOG and OCT4 mRNA expression in A549(OSLN) and A549(OSLN+HIFs) clones compared to H1 cells. (I) Methylation analysis of OCT4 promoter region. White circles represent unmethylated; black circles methylated cytosine-phosphate-guanisine (CpG). Numbers indicate the percentage of unmethylated CpG. (J–K) A549(OSLN+HIFs) tumors present malignant characteristics. Representative H&E-stained section of the xenograft A549(OSLN+HIFs) showing high mitotic index (J) and local invasion (K). (L) Tumors generated by injection of A549(OSLN+HIFs) cells present regions of differentiation. Paraffin embedded sections were subjected to H&E (upper panels) or Alcian blue-PAS (lower panels) staining. Bar right panels equals 100 μm.
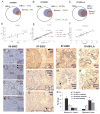
Figure 4. Overlap between HIF, NANOG and OCT4 staining in prostate tumors
(A–C) Venn diagram representations of the staining analysis of specimen 09066C (A), 07-020C (B) and 07-091LA (C). (D–F) Quantification of HIF and NANOG, and HIF and OCT4 colocalization by correlation analysis in specimen 09-066C (D), 07-020C (E) and 07-091LA (F). Each dot represents 200 to 500 cells. The y-axis shows the ratio of HIF positive staining, and the x-axis the ratio of NANOG or OCT4 positive staining. (G–N) Representative images of HIF1α (G–J) and NANOG (K–N) immunohistochemistry staining on serial sections of specimens 09-066C, 07-020C and 07-091LA. Antibody used for NANOG staining is indicated. High magnification images are presented in the lower right corner. (O–P) CD107b (a marker for a tumor region; O) and CD104 (a marker for normal region; P) staining on serial section of the specimen 09-066C. (Q) Representative images of OCT4 immunohistochemistry staining on serial sections of specimen 07-020C. (R) NANOG and OCT4 expressions are enriched in Gleason 5 only glands, compared to the levels seen in overall glands.
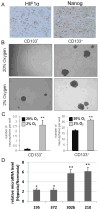
Figure 5. Hypoxia induces stem cell markers and enhances neurosphere formation in gliomas
(A) Adjacent serial sections from a GBM patient tissue sample demonstrates nuclear staining of NANOG and OCT4 in a tumoral region with HIF1α immunoreactivity. Magnifications are 40X. Lower magnifications of the same region are presented in Suppl. Fig.11. (B–C) Hypoxia enhances neurosphere formation. Following collection from T4121 patient specimen, glioma stem and non-stem cells were plated in a 24 well plate at a density of 10 cells/well and cultured in either 2% O2 or 20% O2. After 12 days of treatment, representative phase contrast images were taken at 20X magnification (B). The number of neurospheres per well is presented (C). **, P < 0.01 with ANOVA.. (D) Hypoxia up-regulates hESC enriched microRNA in neurospheres generated from the non-stem population of primary gliomas. Following 12 days of exposure to normoxia or hypoxia (2% O2), the 24 wells of neurospheres derived from non-stem primary glioma cells were pooled for each condition, and the expression of hESC-enriched miRNAs was quantified by RT-qPCR.
Similar articles
- Expression profile of embryonic stem cell-associated genes Oct4, Sox2 and Nanog in human gliomas.
Guo Y, Liu S, Wang P, Zhao S, Wang F, Bing L, Zhang Y, Ling EA, Gao J, Hao A. Guo Y, et al. Histopathology. 2011 Oct;59(4):763-75. doi: 10.1111/j.1365-2559.2011.03993.x. Histopathology. 2011. PMID: 22014056 - [LincRNA-ROR functions as a ceRNA to regulate Oct4, Sox2, and Nanog expression by sponging miR-145 and its effect on biologic characteristics of colonic cancer stem cells].
Yan ZY, Sun XC. Yan ZY, et al. Zhonghua Bing Li Xue Za Zhi. 2018 Apr 8;47(4):284-290. doi: 10.3760/cma.j.issn.0529-5807.2018.04.011. Zhonghua Bing Li Xue Za Zhi. 2018. PMID: 29690669 Chinese. - [Yamanaka's factors and core transcription factors--the molecular link between embryogenesis and carcinogenesis].
Fuławka Ł, Donizy P, Hałoń A. Fuławka Ł, et al. Postepy Hig Med Dosw (Online). 2014 Jun 5;68:715-21. doi: 10.5604/17322693.1107325. Postepy Hig Med Dosw (Online). 2014. PMID: 24934529 Review. Polish. - Networks of Transcription Factors for Oct4 Expression in Mice.
Li YQ. Li YQ. DNA Cell Biol. 2017 Sep;36(9):725-736. doi: 10.1089/dna.2017.3780. Epub 2017 Jul 21. DNA Cell Biol. 2017. PMID: 28731785 Review.
Cited by
- Concise Review: NANOG in Cancer Stem Cells and Tumor Development: An Update and Outstanding Questions.
Jeter CR, Yang T, Wang J, Chao HP, Tang DG. Jeter CR, et al. Stem Cells. 2015 Aug;33(8):2381-90. doi: 10.1002/stem.2007. Epub 2015 May 13. Stem Cells. 2015. PMID: 25821200 Free PMC article. Review. - Hypoxia induces an endometrial cancer stem-like cell phenotype via HIF-dependent demethylation of SOX2 mRNA.
Chen G, Liu B, Yin S, Li S, Guo Y, Wang M, Wang K, Wan X. Chen G, et al. Oncogenesis. 2020 Sep 11;9(9):81. doi: 10.1038/s41389-020-00265-z. Oncogenesis. 2020. PMID: 32913192 Free PMC article. - Immune vulnerability of ovarian cancer stem-like cells due to low CD47 expression is protected by surrounding bulk tumor cells.
Chang CL, Wu CC, Hsu YT, Hsu YC. Chang CL, et al. Oncoimmunology. 2020 Aug 20;9(1):1803530. doi: 10.1080/2162402X.2020.1803530. Oncoimmunology. 2020. PMID: 32923164 Free PMC article. - Expression of Bmi1, FoxF1, Nanog, and γ-catenin in relation to hedgehog signaling pathway in human non-small-cell lung cancer.
Gialmanidis IP, Bravou V, Petrou I, Kourea H, Mathioudakis A, Lilis I, Papadaki H. Gialmanidis IP, et al. Lung. 2013 Oct;191(5):511-21. doi: 10.1007/s00408-013-9490-4. Epub 2013 Jul 18. Lung. 2013. PMID: 23864317 - Hypoxia-inducible factors regulate pluripotency factor expression by ZNF217- and ALKBH5-mediated modulation of RNA methylation in breast cancer cells.
Zhang C, Zhi WI, Lu H, Samanta D, Chen I, Gabrielson E, Semenza GL. Zhang C, et al. Oncotarget. 2016 Oct 4;7(40):64527-64542. doi: 10.18632/oncotarget.11743. Oncotarget. 2016. PMID: 27590511 Free PMC article.
References
- Mohyeldin A, Garzon-Muvdi T, Quinones-Hinojosa A. Oxygen in stem cell biology: a critical component of the stem cell niche. Cell Stem Cell. 2010;7:150–61. - PubMed
- Pouyssegur J, Dayan F, Mazure NM. Hypoxia signalling in cancer and approaches to enforce tumour regression. Nature. 2006;441:437–43. - PubMed
- Mabjeesh NJ, Amir S. Hypoxia-inducible factor (HIF) in human tumorigenesis. Histol Histopathol. 2007;22:559–72. - PubMed
- Reya T, Morrison SJ, Clarke MF, Weissman IL. Stem cells, cancer, and cancer stem cells. Nature. 2001;414:105–11. - PubMed
Publication types
MeSH terms
Substances
Grants and funding
- NS054276/NS/NINDS NIH HHS/United States
- R01 GM083867-02S2/GM/NIGMS NIH HHS/United States
- R01 GM097372-01/GM/NIGMS NIH HHS/United States
- CA112958/CA/NCI NIH HHS/United States
- R01 GM083867/GM/NIGMS NIH HHS/United States
- R01 GM083867-03S1/GM/NIGMS NIH HHS/United States
- R01GM083867-01/GM/NIGMS NIH HHS/United States
- P01 GM081619/GM/NIGMS NIH HHS/United States
- R01 GM083867-04/GM/NIGMS NIH HHS/United States
- R01 NS054276/NS/NINDS NIH HHS/United States
- 1P01GM081619-01/GM/NIGMS NIH HHS/United States
- R01 GM083867-03/GM/NIGMS NIH HHS/United States
- R01 CA116659/CA/NCI NIH HHS/United States
- R01 CA136808/CA/NCI NIH HHS/United States
- R01 GM083867-01A2/GM/NIGMS NIH HHS/United States
- R01 GM097372/GM/NIGMS NIH HHS/United States
- CA116659/CA/NCI NIH HHS/United States
- K02 NS047409/NS/NINDS NIH HHS/United States
- R01 GM083867-02/GM/NIGMS NIH HHS/United States
- NS047409/NS/NINDS NIH HHS/United States
LinkOut - more resources
Full Text Sources
Other Literature Sources
Research Materials


