Tet2 loss leads to increased hematopoietic stem cell self-renewal and myeloid transformation - PubMed (original) (raw)
. 2011 Jul 12;20(1):11-24.
doi: 10.1016/j.ccr.2011.06.001. Epub 2011 Jun 30.
Linsey Reavie, Alan Shih, Omar Abdel-Wahab, Delphine Ndiaye-Lobry, Camille Lobry, Maria E Figueroa, Aparna Vasanthakumar, Jay Patel, Xinyang Zhao, Fabiana Perna, Suveg Pandey, Jozef Madzo, Chunxiao Song, Qing Dai, Chuan He, Sherif Ibrahim, Miloslav Beran, Jiri Zavadil, Stephen D Nimer, Ari Melnick, Lucy A Godley, Iannis Aifantis, Ross L Levine
Affiliations
- PMID: 21723200
- PMCID: PMC3194039
- DOI: 10.1016/j.ccr.2011.06.001
Tet2 loss leads to increased hematopoietic stem cell self-renewal and myeloid transformation
Kelly Moran-Crusio et al. Cancer Cell. 2011.
Abstract
Somatic loss-of-function mutations in the ten-eleven translocation 2 (TET2) gene occur in a significant proportion of patients with myeloid malignancies. Although there are extensive genetic data implicating TET2 mutations in myeloid transformation, the consequences of Tet2 loss in hematopoietic development have not been delineated. We report here an animal model of conditional Tet2 loss in the hematopoietic compartment that leads to increased stem cell self-renewal in vivo as assessed by competitive transplant assays. Tet2 loss leads to a progressive enlargement of the hematopoietic stem cell compartment and eventual myeloproliferation in vivo, including splenomegaly, monocytosis, and extramedullary hematopoiesis. In addition, Tet2(+/-) mice also displayed increased stem cell self-renewal and extramedullary hematopoiesis, suggesting that Tet2 haploinsufficiency contributes to hematopoietic transformation in vivo.
Copyright © 2011 Elsevier Inc. All rights reserved.
Figures
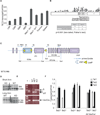
Figure 1. In vitro Tet2 expression silencing leads to increased serial replating
A) Quantification of the shRNA-mediated Tet2 knock-down efficiency using qRT-PCR, B) Quantification of 5-hmC by LC/MS of control (MSCV-IRES-GFP) versus Tet2 knockdown derived cells from after retroviral transduction and GFP sorting. C) CFU assay of bone marrow derive cells infected with control or Tet2 shRNA virus. Colony counts were scored every 14 days. D) Upregulation of surface c-Kit expression in progenitors expressing _Tet2_-specific shRNA. * p < 0.026. Error bars represent ± SD.
Figure 2. Generation of a conditional Tet2 allele
A) qRT-PCR showing relative expression levels of Tet2 in purified progenitor and mature mouse hematopoietic stem and progenitor subsets. B) Exon distribution of TET2 mutations found in AML and CMML patients. C) Schematic depiction of the targeted Tet2 allele. Exon 3 is targeted and flanked by LoxP sites upon Frt-mediated deletion of the NEO cassette. D) Verification of correct homologous recombination using Southern Blots on targeted ES cells. E) Verification of VavCre-mediated excision using genomic PCR. Recombined (Δ), Floxed and wild-type Tet2 alleles are shown. F) Efficiency of Tet2 knock-out using qRT-PCR in purified bone marrow c-Kit+ cells, total thymus and spleen. Expression of Tet1 and Tet3 in wild-type and Tet2 deficient bone marrow cells reveals no differences in Tet1 and Tet3 expression with Tet2 deletion. Error bars represent ± SD. See also Figure S1.
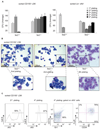
Figure 3. Tet2 deficiency leads to increased serial replating ability in vitro
A) Left Panel: Methylcellulose CFU assay using LSK CD150+ purified cells. Absolute number of colonies is shown at different platings. A similar CFU assay using Lineage−c-Kit+ cells is shown in the right panel. B) Morphology of generated colonies either at the 2nd or 4th plating. Cytospins of the colonies are shown. C) Left panel: Upregulation of surface c-Kit expression at the 2nd and 4th plating. Right Panel: Cell surface expression of CD34 and FcγR on Lin−cKit+ Tet2−/− cells by the 4th plating. A representative example of at least three independent experiments is shown for each assay. Error bars represent ± SD. See also Figure S2.
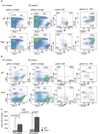
Figure 4. Tet2 deletion leads to progressive defects in bone marrow and extramedullary hematopoiesis
A) FACS analysis of bone marrow stem and progenitor populations of Tet2−/− (vav-Cre+Tet2 _f/_f) and WT (vav-Cre+Tet2wt/wt) at two different ages (4–6 and 20 weeks). Antibody stainings are as indicated. B) Identical antibody labeling as in A) but using spleen cells from Tet2−/− (vav-Cre+Tet2f/f) and WT (vav-Cre+Tet2wt/wt) mice. C) Absolute numbers of spleen LSK cells in Tet2−/− (vav-Cre+Tet2f/f) and WT (vav-Cre+Tet2wt/wt) mice at two different ages. P values are show for each comparison. For all experiments shown in this figure n=8 for each genotype. Error bars represent ± SD. See also Figure S3.
Figure 5. Tet2−/− hematopoietic stem cells show increased re-populating ability consistent with increased self-renewal
A) Schematic depiction of the competitive transplantation scheme. Tet2−/− cells are double positive for CD45.1/CD45.2 markers. Tet2 WT cells are CD45.2 single positive cells. B) Percentage of CD45.1 vs CD45.2 total chimerism in the peripheral blood of recipient animals (n=15 for each genotype). Time (weeks) denotes the time post the termination of polyI-polyC injections. C) Representative FACS plots showing CD45.1/CD45.2 (Tet2−/−) and CD45.2 (Tet2+/+) stainings and chimerism in whole peripheral mononuclear cells, myeloid CD11b+ and lymphoid B220+ cells. Two time points (week 0 and week 23) are shown. D) Representative FACS plots showing CD45.1/CD45.2 (Tet2−/−) and CD45.2 (Tet2+/+) stainings and chimerism within the bone marrow stem (LT-HSC) and progenitor (MPP1, MPP2 and CMP) compartments. Analysis performed at week 23 post-polyI-polyC injection. E) Similar stainings quantifying CD45.1/CD45.2 (Tet2−/−) and CD45.2 (Tet2+/+) expression in bone marrow myeloid (CD11b+) and lymphoid (B220+) mature populations. Week 23 stainings are shown (n=5 for each genotype). Error bars represent ± SD. See also Figure S4.
Figure 6. Tet2−/− animals develop myeloid neoplasia reminiscent of human CMML
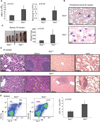
A) Left panel: Automated peripheral blood enumeration of whole blood cells (WBC). Right panel: Manual differential counts of neutrophils and monocytes showing blood monocytosis (n ≥ 3 for each genotype). B) Representative images of peripheral blood smears from Tet2+/+ and Tet2−/− mice at 20 weeks of age (n ≥ 3 for each genotype). C) Splenomegaly in 20-week old Tet2−/− (Vav-Cre+Tet2f/f) animals. Littermate WT (Vav-Cre+Tet2w/w) controls at 20 weeks are used. n=5 mice D) Histologic (H&E) analysis of Tet2−/− and control tissues (bone marrow, spleen, liver and lung) are shown, illustrating disrupted spleen architecture, monocytic infiltrations in liver and lung and bone marrow neutrophilia (n=5 for each genotype). E) Left panel: FACS analysis of spleen CD11b and Gr-1 expressing populations. A representative FACS plot from each genotype is shown. Right panel: total cell number of CD11b+ cells in the spleen of Tet2+/+ and Tet2−/− mice at 20 weeks of age. Error bars represent ± SD. See also Figure S5.
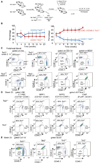
Figure 7. Tet2 haploinsufficiency is able to initiate aberrant in vitro and in vivo hematopoiesis
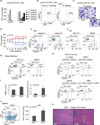
A) Methylcellulose CFU assay using LSK CD150+ cells (Lin−, cKit+, Sca-1+, CD150+). An average of the absolute number of colonies is shown for sequential platings (1–5) (n= 5) B) Representative FACS plot of colony forming assay showing c-Kit expression at the 2nd and 4th plating. C) Wright-Giemsa staining of colonies formed from Tet2+/− CD150+ LSKs (Vav-Cre+Tet2f/w/). Images of cytospins are shown. D) Graph represents chimerism between CD45.2 (Tet2+/−) and CD45.1 (Tet2+/+) in the peripheral blood from a competitive transplantation assay over time (0–23 weeks). Experimental strategy is described in Figure 5A. Blue line indicates WT:WT cohorts and red indicates Tet2+/−:WT cohorts. (n= 5 mice) E) Representative FACS plots showing CD45.1/CD45.2 chimerism in the peripheral blood from CD45.1 (Tet2+/+) and CD45.2 (Tet2+/−)cohorts pre-(wk 0) and post-deletion (23 wk post-polyI-polyC). F–H) Representative FACS plots showing CD45.1 (Tet2+/+) /CD45.2 (Tet2+/−) chimerism at 23 weeks post deletion in myeloid and lymphoid populations in the peripheral blood (F), in the bone marrow (G), and in the bone marrow stem and progenitor cell compartment (H). I) Left panel: Automated peripheral blood enumeration of whole blood cells (WBC). Right panel: Manual differential counts of neutrophils and monocytes showing monocytosis (n ≥ 3 for each genotype). J) Representative FACS plot showing increased frequency of LSKs in the spleen of Tet2+/− mice. Right panel depicts absolute number of LSKs in the spleen of WT and Tet2+/− mice (n=5 for each genotype). K) Hematoxylin and Eosin staining of spleen from 20 week old Tet2+/− mice. Error bars represent ± SD. See also Figure S6.
Comment in
- The role of TET2 in hematologic neoplasms.
Holmfeldt L, Mullighan CG. Holmfeldt L, et al. Cancer Cell. 2011 Jul 12;20(1):1-2. doi: 10.1016/j.ccr.2011.06.025. Cancer Cell. 2011. PMID: 21741591 - Leukaemia and lymphoma: The expansive reach of TET2.
Alderton GK. Alderton GK. Nat Rev Cancer. 2011 Jul 22;11(8):535. doi: 10.1038/nrc3115. Nat Rev Cancer. 2011. PMID: 21779006 No abstract available.
Similar articles
- Aid is a key regulator of myeloid/erythroid differentiation and DNA methylation in hematopoietic stem/progenitor cells.
Kunimoto H, McKenney AS, Meydan C, Shank K, Nazir A, Rapaport F, Durham B, Garrett-Bakelman FE, Pronier E, Shih AH, Melnick A, Chaudhuri J, Levine RL. Kunimoto H, et al. Blood. 2017 Mar 30;129(13):1779-1790. doi: 10.1182/blood-2016-06-721977. Epub 2017 Jan 11. Blood. 2017. PMID: 28077417 Free PMC article. - Oncogenic N-Ras and Tet2 haploinsufficiency collaborate to dysregulate hematopoietic stem and progenitor cells.
Jin X, Qin T, Zhao M, Bailey N, Liu L, Yang K, Ng V, Higashimoto T, Coolon R, Ney G, Figueroa ME, Li Q. Jin X, et al. Blood Adv. 2018 Jun 12;2(11):1259-1271. doi: 10.1182/bloodadvances.2018017400. Blood Adv. 2018. PMID: 29866713 Free PMC article. - Ten-Eleven-Translocation 2 (TET2) negatively regulates homeostasis and differentiation of hematopoietic stem cells in mice.
Ko M, Bandukwala HS, An J, Lamperti ED, Thompson EC, Hastie R, Tsangaratou A, Rajewsky K, Koralov SB, Rao A. Ko M, et al. Proc Natl Acad Sci U S A. 2011 Aug 30;108(35):14566-71. doi: 10.1073/pnas.1112317108. Epub 2011 Aug 22. Proc Natl Acad Sci U S A. 2011. PMID: 21873190 Free PMC article. - The Ten-Eleven Translocation-2 (TET2) gene in hematopoiesis and hematopoietic diseases.
Solary E, Bernard OA, Tefferi A, Fuks F, Vainchenker W. Solary E, et al. Leukemia. 2014 Mar;28(3):485-96. doi: 10.1038/leu.2013.337. Epub 2013 Nov 13. Leukemia. 2014. PMID: 24220273 Review. - Role of TET dioxygenases in the regulation of both normal and pathological hematopoiesis.
Joshi K, Zhang L, Breslin S J P, Kini AR, Zhang J. Joshi K, et al. J Exp Clin Cancer Res. 2022 Oct 7;41(1):294. doi: 10.1186/s13046-022-02496-x. J Exp Clin Cancer Res. 2022. PMID: 36203205 Free PMC article. Review.
Cited by
- Epigenetic therapy of hematological malignancies: where are we now?
Popovic R, Shah MY, Licht JD. Popovic R, et al. Ther Adv Hematol. 2013 Apr;4(2):81-91. doi: 10.1177/2040620712466864. Ther Adv Hematol. 2013. PMID: 23610616 Free PMC article. - Concurrent Zrsr2 mutation and Tet2 loss promote myelodysplastic neoplasm in mice.
Garcia-Ruiz C, Martínez-Valiente C, Cordón L, Liquori A, Fernández-González R, Pericuesta E, Sandoval J, Cervera J, Gutiérrez-Adán A, Sanjuan-Pla A. Garcia-Ruiz C, et al. Leukemia. 2022 Oct;36(10):2509-2518. doi: 10.1038/s41375-022-01674-2. Epub 2022 Aug 27. Leukemia. 2022. PMID: 36030305 Free PMC article. - Ten-eleven translocation methyl-cytosine dioxygenase 2 deficiency exacerbates renal ischemia-reperfusion injury.
Yan H, Tan L, Liu Y, Huang N, Cang J, Wang H. Yan H, et al. Clin Epigenetics. 2020 Jul 2;12(1):98. doi: 10.1186/s13148-020-00892-8. Clin Epigenetics. 2020. PMID: 32616016 Free PMC article. - Physiologic Expression of Sf3b1(K700E) Causes Impaired Erythropoiesis, Aberrant Splicing, and Sensitivity to Therapeutic Spliceosome Modulation.
Obeng EA, Chappell RJ, Seiler M, Chen MC, Campagna DR, Schmidt PJ, Schneider RK, Lord AM, Wang L, Gambe RG, McConkey ME, Ali AM, Raza A, Yu L, Buonamici S, Smith PG, Mullally A, Wu CJ, Fleming MD, Ebert BL. Obeng EA, et al. Cancer Cell. 2016 Sep 12;30(3):404-417. doi: 10.1016/j.ccell.2016.08.006. Cancer Cell. 2016. PMID: 27622333 Free PMC article. - TET2: A cornerstone in normal and malignant hematopoiesis.
Kunimoto H, Nakajima H. Kunimoto H, et al. Cancer Sci. 2021 Jan;112(1):31-40. doi: 10.1111/cas.14688. Epub 2020 Nov 18. Cancer Sci. 2021. PMID: 33048426 Free PMC article. Review.
References
- Abdel-Wahab O, Levine RL. EZH2 Mutations: Mutating the Epigenetic Machinery in Myeloid Malignancies. Cancer Cell. 2010;18:105–107.
- Bolstad BM, Irizarry RA, Astrand M, Speed TP. A comparison of normalization methods for high density oligonucleotide array data based on variance and bias. Bioinformatics. 2003;19:185–193. - PubMed
Publication types
MeSH terms
Substances
Grants and funding
- F31 AG039991/AG/NIA NIH HHS/United States
- HHMI/Howard Hughes Medical Institute/United States
- R01 CA105129/CA/NCI NIH HHS/United States
- F31-AG039991/AG/NIA NIH HHS/United States
- R21 CA141399/CA/NCI NIH HHS/United States
- R01CA149655/CA/NCI NIH HHS/United States
- CA129831/CA/NCI NIH HHS/United States
- R01CA105129/CA/NCI NIH HHS/United States
- P30 CA016087/CA/NCI NIH HHS/United States
- U54 CA143798/CA/NCI NIH HHS/United States
- P30 CA016087-30/CA/NCI NIH HHS/United States
- 5 P30CA16087-31/CA/NCI NIH HHS/United States
- R01 CA133379/CA/NCI NIH HHS/United States
- R01CA133379/CA/NCI NIH HHS/United States
- R01 CA129831/CA/NCI NIH HHS/United States
- 5P30CA16087-31/CA/NCI NIH HHS/United States
- R21CA141399/CA/NCI NIH HHS/United States
- CA129831-03S1/CA/NCI NIH HHS/United States
- R01 CA149655/CA/NCI NIH HHS/United States
- 1R01CA138234-01/CA/NCI NIH HHS/United States
- R01GM088847/GM/NIGMS NIH HHS/United States
- R01 CA138234/CA/NCI NIH HHS/United States
- U54CA143798-01/CA/NCI NIH HHS/United States
- R01 GM088847/GM/NIGMS NIH HHS/United States
LinkOut - more resources
Full Text Sources
Other Literature Sources
Medical
Molecular Biology Databases
Research Materials

