Variants of the protein PRDM9 differentially regulate a set of human meiotic recombination hotspots highly active in African populations - PubMed (original) (raw)
Variants of the protein PRDM9 differentially regulate a set of human meiotic recombination hotspots highly active in African populations
Ingrid L Berg et al. Proc Natl Acad Sci U S A. 2011.
Abstract
PRDM9 is a major specifier of human meiotic recombination hotspots, probably via binding of its zinc-finger repeat array to a DNA sequence motif associated with hotspots. However, our view of PRDM9 regulation, in terms of motifs defined and hotspots studied, has a strong bias toward the PRDM9 A variant particularly common in Europeans. We show that population diversity can reveal a second class of hotspots specifically activated by PRDM9 variants common in Africans but rare in Europeans. These African-enhanced hotspots nevertheless share very similar properties with their counterparts activated by the A variant. The specificity of hotspot activation is such that individuals with differing PRDM9 genotypes, even within the same population, can use substantially if not completely different sets of hotspots. Each African-enhanced hotspot is activated by a distinct spectrum of PRDM9 variants, despite the fact that all are predicted to bind the same sequence motif. This differential activation points to complex interactions between the zinc-finger array and hotspots and identifies features of the array that might be important in controlling hotspot activity.
Conflict of interest statement
The authors declare no conflict of interest.
Figures
Fig. 1.
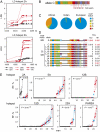
Detection of cross-over hotspots activated by African PRDM9 variants. (A) Metric LD plots in linkage disequilibrium units (LDU) (27) of HapMap genotype data (10, 11) showing examples of putative African-specific LD hotspots detected by strong LD breakdown in four African populations (red: LWK, Luhya from Kenya; MKK, Maasai from Kenya; YRI, Yoruba from Nigeria; ASW, individuals of African ancestry in the Southwest USA) and weak LD breakdown in Utah residents with Northern and Western European ancestry (CEU) and in Gujarati Indians in Houston (GIH) (black). LD hotspots were named after the chromosome (e.g., hotspot 2A is located on chromosome 2). Chromosome coordinates are taken from human genome assembly GRCh37/hg19, Ensembl release 61. (B) Structure of the ZnF repeat array in the PRDM9 C variant, with variant repeats (defined in
Fig. S1 A and B
) colored differently. The predicted DNA binding motif below is aligned to the PRDM9 A motif, showing at best only 5/8 matching bases. (C) Frequencies of PRDM9 variants, classified by their predicted binding match to the PRDM9 A motif, in different populations. (D) Aligned structures of PRDM9 Ct variants showing a 5/8 match with the A motif. All are predicted to recognize the same DNA binding motif, possibly extended for variant L19 (
Fig. S2
). Allele frequencies in Europeans and Africans are given on the right, with common alleles (frequency >5%) indicated in red. (E) Sperm cross-over frequencies, with 95% confidence intervals, in different men either lacking PRDM9 Ct alleles (black) or containing one Ct allele (red) or two Ct alleles (blue) at each of the six LD hotspot intervals analyzed. Men within each group are ranked in ascending order of cross-over activity. Different sets of men were tested at each hotspot depending on the availability of informative SNPs required for cross-over detection. The significance of association between cross-over activity and the presence of Ct alleles, as established by two-tailed Mann–Whitney tests on ranked cross-over frequencies for each hotspot, is given.
Fig. 2.
Cross-over frequencies in men carrying different PRDM9 Ct alleles. Data were scored at each hotspot for all men carrying a Ct allele plus another allele known to be nonactivating (usually allele A), allowing Ct activity to be estimated. Cross-over frequencies at <2% of maximum activity are indicated in blue, and nonactivating or very weakly activating alleles are marked with a cross. Allele/hotspot combinations for which no informative men were available are shaded in gray.
Fig. 3.
Sperm cross-over distributions across genomic intervals regulated by PRDM9 Ct variants. Cross-over molecules from men carrying the Ct allele indicated at top right were mapped by using internal SNPs. Different men carrying the same Ct allele are indicated by different symbols of the same color. Cumulative cross-over frequencies for each man were estimated by mapping 25–215 cross-overs in each orientation and combining reciprocal cross-over data; the only exceptions were at hotspot PAR2A, where two C carriers and the L14 carrier were mapped in only one orientation. Data from all men were combined to estimate the least-squares best-fit cumulative normal distribution (black line) at each hotspot (3). The L6 carrier at hotspot 5A shows a cross-over distribution (red line) significantly shifted by 0.3 kb relative to the hotspot in other tested men (Fisher exact test on numbers of cross-overs mapping 5′ and 3′ to the central C/T SNP rs13355978 in the L6 carrier vs. three other mapped C/T heterozygotes, P < 10−6). The best-fit distributions were used to estimate the center of each hotspot (gray line) and its width within which 95% of cross-overs are located, as indicated. Sequence matches with the binding motif predicted for PRDM9 Ct variants (CCNCNNTNNNCNTNNC) (2) and the A variant (CCNCCNTNNCCNC) (4, 6) are shown above each graph in red and blue, respectively, with perfect matches indicated by large lines and single base mismatches by small lines. Coordinates of hotspot centers are given in
Table S1
.
Fig. 4.
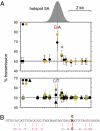
Biased gene conversion accompanying cross-over at hotspot 5A. (A) Transmission frequencies of SNP alleles into cross-over progeny, normalized to equal numbers of reciprocal cross-overs and with 95% confidence intervals. Data for different men are colored according to the PRDM9 Ct allele they carry, as in Fig. 3. Upper shows data from two men heterozygous for a central A/G SNP, with transmission frequencies shown for SNPs from the haplotype carrying the G allele. Significant transmission distortion was seen not only at the A/G SNP but also at a second SNP (*) 410 bp downstream but within the hotspot. Lower shows data from 5 men, all A/A homozygotes at this SNP, with transmissions from the C haplotype in the three C/T heterozygotes at a SNP only 106 bp away from the A/G SNP; this SNP is therefore sufficiently central to detect any biased gene conversion. The morphology of the cross-over hotspot (Fig. 3) is shown above Upper, with the hotspot center marked with a dashed line. (B) Matches to the predicted PRDM9 C binding motif CCNCNNTNNNCNTNNC at the center of the hotspot and spanning the central A/G SNP.
Fig. 5.
Gene conversion activity at hotspots activated by PRDM9 Ct variants. (A) Cross-over and nonexchange conversion activity at hotspot 5A in a PRDM9 C/C homozygote. The cross-over profile (Upper) was established from 120 reciprocal cross-overs detected in 28,000 sperm, whereas conversion frequencies per SNP, with 95% confidence intervals (Lower), were determined from 40 conversions also detected. Frequencies are shown separately for transfer of markers from the haplotype carrying the central G allele to the haplotype with the A allele (red) and for haplotype A→G transfers (black). (B) Comparison of sperm cross-over frequencies at hotspot PAR2A with nonexchange conversion frequencies at the two central SNPs (black, red) (Fig. 3) showing maximum conversion activity. Five men were tested carrying activating Ct alleles (circle, allele C; triangle, allele L14), plus two men with nonactivating Ct alleles and seven men lacking Ct alleles. All men were informative at one or both of the central SNPs.
Fig. 6.
Relationship between current and historical cross-over activity at five Ct-regulated hotspots, shown for Africans (red) and Europeans (black). The current cross-over frequency in a population was estimated as ∑2_rifi_, where ri is the mean cross-over frequency in sperm from men carrying the i_th activating PRDM9 variant, and fi is the population frequency of the variant. We assumed that Ct homozygotes would show twice the activity of carriers (9). Historical activities were estimated by using LDhat (14) from HapMap genotype data for the populations shown in Fig. 1_A (
Table S1
), and then averaged over all African populations. The dotted lines show the expected relationship if current and historical activities are identical, in black for hotspots equally active in male and female meiosis and in blue for male-specific hotspots. Note that current activity will be slightly underestimated at those hotspots where not all rare PRDM9 Ct variants could be tested (Fig. 2).
Similar articles
- PRDM9 is a major determinant of meiotic recombination hotspots in humans and mice.
Baudat F, Buard J, Grey C, Fledel-Alon A, Ober C, Przeworski M, Coop G, de Massy B. Baudat F, et al. Science. 2010 Feb 12;327(5967):836-40. doi: 10.1126/science.1183439. Epub 2009 Dec 31. Science. 2010. PMID: 20044539 Free PMC article. - Drive against hotspot motifs in primates implicates the PRDM9 gene in meiotic recombination.
Myers S, Bowden R, Tumian A, Bontrop RE, Freeman C, MacFie TS, McVean G, Donnelly P. Myers S, et al. Science. 2010 Feb 12;327(5967):876-9. doi: 10.1126/science.1182363. Epub 2009 Dec 31. Science. 2010. PMID: 20044541 Free PMC article. - Multimer Formation Explains Allelic Suppression of PRDM9 Recombination Hotspots.
Baker CL, Petkova P, Walker M, Flachs P, Mihola O, Trachtulec Z, Petkov PM, Paigen K. Baker CL, et al. PLoS Genet. 2015 Sep 14;11(9):e1005512. doi: 10.1371/journal.pgen.1005512. eCollection 2015 Sep. PLoS Genet. 2015. PMID: 26368021 Free PMC article. - The consequences of sequence erosion in the evolution of recombination hotspots.
Tiemann-Boege I, Schwarz T, Striedner Y, Heissl A. Tiemann-Boege I, et al. Philos Trans R Soc Lond B Biol Sci. 2017 Dec 19;372(1736):20160462. doi: 10.1098/rstb.2016.0462. Philos Trans R Soc Lond B Biol Sci. 2017. PMID: 29109225 Free PMC article. Review. - The case of the fickle fingers: how the PRDM9 zinc finger protein specifies meiotic recombination hotspots in humans.
Ségurel L, Leffler EM, Przeworski M. Ségurel L, et al. PLoS Biol. 2011 Dec;9(12):e1001211. doi: 10.1371/journal.pbio.1001211. Epub 2011 Dec 6. PLoS Biol. 2011. PMID: 22162947 Free PMC article. Review.
Cited by
- sgcocaller and comapr: personalised haplotype assembly and comparative crossover map analysis using single-gamete sequencing data.
Lyu R, Tsui V, Crismani W, Liu R, Shim H, McCarthy DJ. Lyu R, et al. Nucleic Acids Res. 2022 Nov 11;50(20):e118. doi: 10.1093/nar/gkac764. Nucleic Acids Res. 2022. PMID: 36107768 Free PMC article. - Natural variation in the zinc-finger-encoding exon of Prdm9 affects hybrid sterility phenotypes in mice.
AbuAlia KFN, Damm E, Ullrich KK, Mukaj A, Parvanov E, Forejt J, Odenthal-Hesse L. AbuAlia KFN, et al. Genetics. 2024 Mar 6;226(3):iyae004. doi: 10.1093/genetics/iyae004. Genetics. 2024. PMID: 38217871 Free PMC article. - Meiotic recombinations within major histocompatibility complex of human embryos.
Taylan F, Altiok E. Taylan F, et al. Immunogenetics. 2012 Nov;64(11):839-44. doi: 10.1007/s00251-012-0644-y. Epub 2012 Aug 15. Immunogenetics. 2012. PMID: 22893033 - Personalized genome structure via single gamete sequencing.
Lyu R, Tsui V, McCarthy DJ, Crismani W. Lyu R, et al. Genome Biol. 2021 Apr 19;22(1):112. doi: 10.1186/s13059-021-02327-w. Genome Biol. 2021. PMID: 33874978 Free PMC article. Review. - Zinc finger binding motifs do not explain recombination rate variation within or between species of Drosophila.
Heil CS, Noor MA. Heil CS, et al. PLoS One. 2012;7(9):e45055. doi: 10.1371/journal.pone.0045055. Epub 2012 Sep 18. PLoS One. 2012. PMID: 23028758 Free PMC article.
References
- Myers S, Bottolo L, Freeman C, McVean G, Donnelly P. A fine-scale map of recombination rates and hotspots across the human genome. Science. 2005;310:321–324. - PubMed
- Kong A, et al. Fine-scale recombination rate differences between sexes, populations and individuals. Nature. 2010;467:1099–1103. - PubMed
- Jeffreys AJ, Kauppi L, Neumann R. Intensely punctate meiotic recombination in the class II region of the major histocompatibility complex. Nat Genet. 2001;29:217–222. - PubMed
- Myers S, Freeman C, Auton A, Donnelly P, McVean G. A common sequence motif associated with recombination hot spots and genome instability in humans. Nat Genet. 2008;40:1124–1129. - PubMed
Publication types
MeSH terms
Substances
LinkOut - more resources
Full Text Sources
Molecular Biology Databases


