Modulation of the unfolded protein response is the core of microRNA-122-involved sensitivity to chemotherapy in hepatocellular carcinoma - PubMed (original) (raw)
Modulation of the unfolded protein response is the core of microRNA-122-involved sensitivity to chemotherapy in hepatocellular carcinoma
Fu Yang et al. Neoplasia. 2011 Jul.
Abstract
The loss of microRNA-122 (miR-122) expression correlates to many characteristic properties of hepatocellular carcinoma (HCC) cells, including clonogenic survival, anchorage-independent growth, migration, invasion, epithelial-mesenchymal transition, and tumorigenesis. However, all of these findings do not sufficiently explain the oncogenic potential of miR-122. In the current study, we used two-dimensional differential in-gel electrophoresis to measure changes in the expression of thousands of proteins in response to the inhibition of miR-122 in human hepatoma cells. Several proteins that were upregulated on miR-122 inhibition were involved in the unfolded protein response (UPR) pathway. The overexpression of miR-122 resulted in the repression of UPR pathway activation. Therefore, miR-122 may act as an inhibitor of the chaperone gene expression and negatively regulate the UPR pathway in HCC. We further showed that the miR-122 inhibitor enhanced the stability of the 26S proteasome non-ATPase regulatory subunit 10 (PSMD10) through the up-regulation of its target gene cyclin-dependent kinase 4 (CDK4). This process may activate the UPR pathway to prevent chemotherapy-mediated tumor cell apoptosis. The current study suggests that miR-122 negatively regulates the UPR through the CDK4-PSMD10 pathway. The down-regulation of miR-122 activated the CDK4-PSMD10-UPR pathway to decrease tumor cell anticancer drug-mediated apoptosis. We identified a new HCC therapeutic target and proclaimed the potential risk of the therapeutic use of miR-122 silencing.
Figures
Figure 1
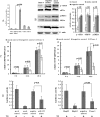
Down-regulation of miR-122 in Huh7 cells and the differentially expressed protein spots displayed in two-dimensional DIGE images. (A) Huh7 cells were transiently transfected with the miR-122 inhibitor or the control RNA. After 48 hours, the transfected cells were harvested for real-time PCR analysis of the miR-122 expression. Values indicate the 72% reduction of miR-122 expression in miR-122 inhibitor-transfected Huh7 cells compared to that in the control cells. (B) The extracted proteins were labeled with fluorescent dyes and separated using DIGE. The numbered spots indicate the differentially expressed protein spots. (C) CALR, SET, ERP29, and PMSD10 were overexpressed when the miR-122 was inhibited in Huh7 cells. Western blot analysis was used to assess the expression level of the four proteins. A representative blot (left) and the numeric data obtained from the densitometry analysis of the blots (right; n = 4) are shown.
Figure 2
Screening of HepG2 cells that stably overexpressing miR-122 and the ER stress reporter assay. (A) The expression level of miR-122 was measured in stably transfected clones. Clone 1, which displayed a 32-fold increase in the miR-122 expression, had the highest miR-122 expression level. Clone 1 was used as a stable miR-122-overexpressing HepG2 cell line throughout the study. (B) Western blot analysis was used to assess the protein expression of GRP78, p-eIF2α, and p-IRE1α in HepG2-miR-122 cells (clone 1) compared to that in HepG2-control cells at 24 hours after TG addition. A representative blot (left), and the numeric data obtained from the densitometry analysis of the blots (right; n = 4) are shown. (C) The mRNA expression of GRP78 (left) and CHOP (right) was significantly decreased in HepG2-miR-122 cells (clone 1) compared to that in HepG2-control cells (negative control) at every time point after TG addition. (D) For the ER stress reporter assay, miR-122 mimic-transfected HepG2 cells (1–3 x 10⁴ cells) were transfected with different reporter plasmids (100 ng per well) using the Cignal ERSE Reporter kit at 6 hours after mimic transfection. Other experiment procedures were performed as described in Materials and Methods. The luciferase activity was decreased in miR-122 mimic-transfected HepG2 cells (left) and clone 1 cells (right). All data represent the mean values ± SD from experiments performed at least five times.
Figure 3
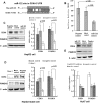
CDK4 was confirmed as a target of miR-122. (A) The miR-122 binding site in the 3′UTR of CDK4 is shown. (B) The verification of binding site specificity is shown. The reduction of the luciferase activity that was driven by the CDK4-3′UTR construct was observed in cells transfected with miR-122 mimic. (C, D, and E) The negative regulation of CDK4 by miR-122 was demonstrated using Western blot analysis. These results indicates that the protein expression of CDK4 is inhibited in miR-122 mimic-transfected HepG2 cells (C), stable miR-122-expressing HepG2 cells (D) and is increased in the miR-122 inhibitor-transfected Huh7 cells (E). The expression of PSMD10 was also changed based on the level of miR-122. The representative blots (left) and numeric data obtained from densitometry analysis of the blots (right, n = 4) are shown.
Figure 4
The miR-122 inhibitor enhanced the PSMD10 stability through its target gene CDK4. (A) At 24 hours after the miR-122 inhibitor and the negative control were transfected, Huh7 cells were incubated with the protein synthesis inhibitor cycloheximide (CHX, 0.5 _µ_g/_µ_l) or the proteasome inhibitor MG-132 (5 _µ_M) for another 24 hours. The protein expression of PSMD10 was detected using Western blot analysis. MG-132 treatment but not CHX treatment abolished the change in the expression of PSMD10 in miR-122 inhibitor- and negative control-transfected cells. (B) At 6 hours after the miR-122 inhibitor and the negative control were transfected, Huh7 cells were incubated with CHX (0.5 _µ_g/µ_l) for another 6, 12, 24, or 36 hours. The protein expression of PSMD10 was detected using Western blot analysis. (C) siRNA against CDK4 abolished the increased PSMD10 protein expression in miR-122 inhibitor-transfected Huh7 cells (n = 4). (D) PSMD10 siRNA decreased GRP78 protein expression in miR-122 inhibitor-transfected Huh7 cells (n = 4). (E) The miR-122 inhibitor and PSMD10 siRNA-cotransfected Huh7 cells were treated as described in Figure 2_D. The results from the ER stress reporter assay show that the luciferase activity is decreased in miR-122 inhibitor-transfected Huh7 cells transfected with PSMD10 siRNA (n = 4). For Western blot analysis, the relative ratios after normalization are shown below each panel.
Figure 5
PSMD10 mediated miR-122 inhibitor-induced drug resistance. (A) Western blot detection of cleaved caspase 3 is shown. Twenty-four hours after Huh7 cells were transfected with the miR-122 inhibitor or the control, Huh7 cells were incubated with cisplatin (8 _µ_g/ml) for another 24 hours. C-Caspase3 indicates cleaved caspase 3 (n = 4). (B) The relative live cell number was determined using the CCK-8 assay (mean ± SD). Huh7 cells were incubated with different concentrations of cisplatin for another 24 hours after transfection with the miR-122 inhibitor or the control (n = 4). (C) Caspase 3/7 activity was detected using an ApoONE Homogeneous Caspase 3/7 Assay. Twenty-four hours after Huh7 cells were cotransfected with the miR-122 inhibitor and siRNA against PSMD10 or respective control, Huh7 cells were stimulatedwith DOX (1 _µ_g/ml) for another 24 hours. (D) Relative live cell number was determined byway of CCK-8 assay. Twenty-four hours after Huh7 cells were transfected with the miR-122 inhibitor, siRNA against PSMD10 or their respective controls. Huh7 cells were stimulated with different concentrations of DOX for another 24 hours. siRNA, siRNA against PSMD10; Control indicates the corresponding negative control for miR-122 inhibitor; NC, the corresponding negative control for siRNA against PSMD10. (For 0.2 _µ_g/ml, miR-122 inhibitor + NC vs controls + NC [P = .032], miR-122 inhibitor + siRNA vs controls + NC [P = .56]; for 0.8 _µ_g/ml, miR-122 inhibitor + NC vs controls + NC [P = .028], miR-122 inhibitor + siRNA vs controls + NC [P = .82]; n = 4).
Figure 6
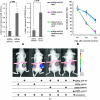
Tumor chemotherapy in nude mice. Tumor establishment, plasmids, and DOX injection were performed as described in the main text. (A) The effectiveness of the plasmids miRZip-miR-122 and shRNA-PSMD10 was examined by real-time PCR using tumor tissues implanted in nude mice. (B) The relative luciferase signal captured in each tumor at different time points is shown (n = 4). On days 6, 9, and 12 after the intratumorally injection of plasmid, the mice were imaged using IVIS Lumina II System as described in Materials and Methods. (C) Photographs of tumors that developed in mice were obtained by imaging with the IVIS system. The representative of luciferase signal (ROI) was captured in each group at day 9 after the plasmid injection. The most effective RNAi expression vector for human PSMD10, shRNA-PSMD10, was used.
Similar articles
- MiR-21 mediates sorafenib resistance of hepatocellular carcinoma cells by inhibiting autophagy via the PTEN/Akt pathway.
He C, Dong X, Zhai B, Jiang X, Dong D, Li B, Jiang H, Xu S, Sun X. He C, et al. Oncotarget. 2015 Oct 6;6(30):28867-81. doi: 10.18632/oncotarget.4814. Oncotarget. 2015. PMID: 26311740 Free PMC article. - Rhamnetin induces sensitization of hepatocellular carcinoma cells to a small molecular kinase inhibitor or chemotherapeutic agents.
Jia H, Yang Q, Wang T, Cao Y, Jiang QY, Ma HD, Sun HW, Hou MX, Yang YP, Feng F. Jia H, et al. Biochim Biophys Acta. 2016 Jul;1860(7):1417-30. doi: 10.1016/j.bbagen.2016.04.007. Epub 2016 Apr 14. Biochim Biophys Acta. 2016. PMID: 27091611 - MicroRNA-383 inhibits doxorubicin resistance in hepatocellular carcinoma by targeting eukaryotic translation initiation factor 5A2.
Tu C, Chen W, Wang S, Tan W, Guo J, Shao C, Wang W. Tu C, et al. J Cell Mol Med. 2019 Nov;23(11):7190-7199. doi: 10.1111/jcmm.14197. Epub 2019 Feb 23. J Cell Mol Med. 2019. PMID: 30801960 Free PMC article. - MicroRNA-31-5p regulates chemosensitivity by preventing the nuclear location of PARP1 in hepatocellular carcinoma.
Que KT, Zhou Y, You Y, Zhang Z, Zhao XP, Gong JP, Liu ZJ. Que KT, et al. J Exp Clin Cancer Res. 2018 Nov 6;37(1):268. doi: 10.1186/s13046-018-0930-0. J Exp Clin Cancer Res. 2018. PMID: 30400960 Free PMC article. Retracted. - Protein phosphatase 2A-B55δ enhances chemotherapy sensitivity of human hepatocellular carcinoma under the regulation of microRNA-133b.
Zhuang Q, Zhou T, He C, Zhang S, Qiu Y, Luo B, Zhao R, Liu H, Lin Y, Lin Z. Zhuang Q, et al. J Exp Clin Cancer Res. 2016 Apr 14;35:67. doi: 10.1186/s13046-016-0341-z. J Exp Clin Cancer Res. 2016. PMID: 27074866 Free PMC article.
Cited by
- MiR-376c down-regulation accelerates EGF-dependent migration by targeting GRB2 in the HuCCT1 human intrahepatic cholangiocarcinoma cell line.
Iwaki J, Kikuchi K, Mizuguchi Y, Kawahigashi Y, Yoshida H, Uchida E, Takizawa T. Iwaki J, et al. PLoS One. 2013 Jul 26;8(7):e69496. doi: 10.1371/journal.pone.0069496. Print 2013. PLoS One. 2013. PMID: 23922722 Free PMC article. - Complex interactions between microRNAs and hepatitis B/C viruses.
Fan HX, Tang H. Fan HX, et al. World J Gastroenterol. 2014 Oct 7;20(37):13477-92. doi: 10.3748/wjg.v20.i37.13477. World J Gastroenterol. 2014. PMID: 25309078 Free PMC article. Review. - MicroRNA Dysregulation in Cystic Fibrosis.
McKiernan PJ, Greene CM. McKiernan PJ, et al. Mediators Inflamm. 2015;2015:529642. doi: 10.1155/2015/529642. Epub 2015 Jun 22. Mediators Inflamm. 2015. PMID: 26185362 Free PMC article. Review. - Micro(RNA)managing endoplasmic reticulum stress.
Byrd AE, Brewer JW. Byrd AE, et al. IUBMB Life. 2013 May;65(5):373-81. doi: 10.1002/iub.1151. Epub 2013 Apr 3. IUBMB Life. 2013. PMID: 23554021 Free PMC article. Review. - Inhibition of alpha interferon (IFN-α)-induced microRNA-122 negatively affects the anti-hepatitis B virus efficiency of IFN-α.
Hao J, Jin W, Li X, Wang S, Zhang X, Fan H, Li C, Chen L, Gao B, Liu G, Meng S. Hao J, et al. J Virol. 2013 Jan;87(1):137-47. doi: 10.1128/JVI.01710-12. Epub 2012 Oct 10. J Virol. 2013. PMID: 23055569 Free PMC article.
References
- Kim I, Xu W, Reed JC. Cell death and endoplasmic reticulum stress: disease relevance and therapeutic opportunities. Nat Rev Drug Discov. 2008;7:1013–1030. - PubMed
- Onn A, Ron D. Modeling the endoplasmic reticulum unfolded protein response. Nat Struct Mol Biol. 2010;17:924–925. - PubMed
- Healy SJ, Gorman AM, Mousavi-Shafaei P, Gupta S, Samali A. Targeting the endoplasmic reticulum-stress response as an anticancer strategy. Eur J Pharmacol. 2009;625:234–246. - PubMed
- Ma Y, Hendershot LM. The role of the unfolded protein response in tumour development: friend or foe? Nat Rev Cancer. 2004;4:966–977. - PubMed
- Scriven P, Brown NJ, Pockley AG, Wyld L. The unfolded protein response and cancer: a brighter future unfolding? J Mol Med. 2007;85:331–341. - PubMed
Publication types
MeSH terms
Substances
LinkOut - more resources
Full Text Sources
Other Literature Sources
Medical


