Top-down quantitative proteomics identified phosphorylation of cardiac troponin I as a candidate biomarker for chronic heart failure - PubMed (original) (raw)
. 2011 Sep 2;10(9):4054-65.
doi: 10.1021/pr200258m. Epub 2011 Jul 28.
Moltu J Guy, Holly S Norman, Yi-Chen Chen, Qingge Xu, Xintong Dong, Huseyin Guner, Sijian Wang, Takushi Kohmoto, Ken H Young, Richard L Moss, Ying Ge
Affiliations
- PMID: 21751783
- PMCID: PMC3170873
- DOI: 10.1021/pr200258m
Top-down quantitative proteomics identified phosphorylation of cardiac troponin I as a candidate biomarker for chronic heart failure
Jiang Zhang et al. J Proteome Res. 2011.
Abstract
The rapid increase in the prevalence of chronic heart failure (CHF) worldwide underscores an urgent need to identify biomarkers for the early detection of CHF. Post-translational modifications (PTMs) are associated with many critical signaling events during disease progression and thus offer a plethora of candidate biomarkers. We have employed a top-down quantitative proteomics methodology for comprehensive assessment of PTMs in whole proteins extracted from normal and diseased tissues. We systematically analyzed 36 clinical human heart tissue samples and identified phosphorylation of cardiac troponin I (cTnI) as a candidate biomarker for CHF. The relative percentages of the total phosphorylated cTnI forms over the entire cTnI populations (%P(total)) were 56.4 ± 3.5%, 36.9 ± 1.6%, 6.1 ± 2.4%, and 1.0 ± 0.6% for postmortem hearts with normal cardiac function (n = 7), early stage of mild hypertrophy (n = 5), severe hypertrophy/dilation (n = 4), and end-stage CHF (n = 6), respectively. In fresh transplant samples, the %P(total) of cTnI from nonfailing donor (n = 4), and end-stage failing hearts (n = 10) were 49.5 ± 5.9% and 18.8 ± 2.9%, respectively. Top-down MS with electron capture dissociation unequivocally localized the altered phosphorylation sites to Ser22/23 and determined the order of phosphorylation/dephosphorylation. This study represents the first clinical application of top-down MS-based quantitative proteomics for biomarker discovery from tissues, highlighting the potential of PTMs as disease biomarkers.
Figures
Fig. 1
Schematic representation of top-down quantitative proteomics methodology featuring affinity-chromatography and high-resolution MS for comprehensive analysis of PTMs in whole proteins extracted from normal and diseased tissues.
Fig. 2
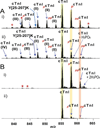
Representative high-resolution ESI/FTMS spectra of whole cTnI (M28+) purified from (A) postmortem and (B) fresh transplant human heart samples. A, i) NOR2; ii) HYP3; and B, i) DOR1; (ii) ICM3. Roman numerals (II–IV) indicate three different C-terminally truncated isoforms of N-terminally acetylated cTnI (II, 1–207; III, 1–206, IV, 1–205). Subscripts p and pp stand for mono and bisphosphorylation. +H3PO4, non-covalent adduct of phosphoric acid. Asterisks indicate co-purified minor cTnT related products. NOR, control heart with normal function; HYP, mild hypertrophy; DOR, donor heart; ICM, ischemic cardiomyopathy. Clinical details of the myocardial tissue samples were shown in Table S1–2.
Fig. 3
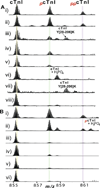
Correlation between the cTnI phosphorylation level and heart disease phenotypes. Representative cases from (A) postmortem heart samples: i–ii) NOR2,3; iii–iv) HYP2,3; v–vi) SHD1,2; vii–viii) CHF2,3; and (B) fresh transplant heart samples, i–ii) DOR1,4; iii–iv) ICM3, 6; v–vi) DCM 3,4. Clinical details of the myocardial tissue samples were shown in Supplemental Table S1–2.
Fig. 4
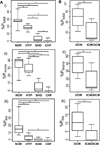
Relative quantification of cTnI phosphorylation in normal and diseased human heart samples. (A) postmortem (NOR, control heart with normal function; HYP, mild hypertrophy, SHD, severe hypertrophy/dilation; CHF, congestive heart failure), and (B) fresh transplant (DOR, donor heart; ICM/DCM, ischemic/dilated cardiomyopathy) samples. i) Total phosphorylated cTnI percentage (%Ptotal); ii) mono-phosphorylated cTnI percentage (%Pmono); and iii) bis-phosphorylated cTnI percentage (%Pbis) over the entire cTnI populations. Box, median and interquartile range (25%, 75%); whiskers, minimum and maximum values. *p<0.05.
Fig. 5
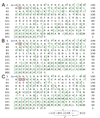
Mapping cTnI phosphorylation sites by top-down MS with ECD. Fragmentation maps of _p_cTnI in (A) normal, (B) hypertrophic heart samples and (C) _pp_cTnI in normal heart samples. The identified phosphorylation site(s) of Ser22 in _p_cTnI and Ser22/23 in _pp_cTnI are highlighted in circles.
Fig. 6
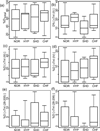
Relative quantification of cTnI degradation levels in normal and diseased heart samples. NOR, normal controls, HYP, mild hypertrophy, SHD, severe hypertrophy/dilation, and CHF, congestive heart failure. (a) Total degraded cTnI percentage (%Dtotal); (b–f) percentages of degradation products cTnI(II), (III), (IV), [Y28–205K], [Y28–206K], over the entire cTnI populations, respectively. Calculated p values were not found to be statistically significant
Comment in
- Modified troponin I as a candidate marker for chronic heart failure: a top-down perspective.
Agnetti G. Agnetti G. Circ Cardiovasc Genet. 2011 Oct;4(5):579-80. doi: 10.1161/CIRCGENETICS.111.961573. Circ Cardiovasc Genet. 2011. PMID: 22010167 No abstract available.
Similar articles
- Deciphering modifications in swine cardiac troponin I by top-down high-resolution tandem mass spectrometry.
Zhang J, Dong X, Hacker TA, Ge Y. Zhang J, et al. J Am Soc Mass Spectrom. 2010 Jun;21(6):940-8. doi: 10.1016/j.jasms.2010.02.005. Epub 2010 Feb 10. J Am Soc Mass Spectrom. 2010. PMID: 20223681 Free PMC article. - Unraveling molecular complexity of phosphorylated human cardiac troponin I by top down electron capture dissociation/electron transfer dissociation mass spectrometry.
Zabrouskov V, Ge Y, Schwartz J, Walker JW. Zabrouskov V, et al. Mol Cell Proteomics. 2008 Oct;7(10):1838-49. doi: 10.1074/mcp.M700524-MCP200. Epub 2008 Apr 28. Mol Cell Proteomics. 2008. PMID: 18445579 - Top-down mass spectrometry of cardiac myofilament proteins in health and disease.
Peng Y, Ayaz-Guner S, Yu D, Ge Y. Peng Y, et al. Proteomics Clin Appl. 2014 Aug;8(7-8):554-68. doi: 10.1002/prca.201400043. Proteomics Clin Appl. 2014. PMID: 24945106 Free PMC article. Review. - Top-down Proteomics: Technology Advancements and Applications to Heart Diseases.
Cai W, Tucholski TM, Gregorich ZR, Ge Y. Cai W, et al. Expert Rev Proteomics. 2016 Aug;13(8):717-30. doi: 10.1080/14789450.2016.1209414. Epub 2016 Jul 26. Expert Rev Proteomics. 2016. PMID: 27448560 Free PMC article. Review.
Cited by
- Distinct hypertrophic cardiomyopathy genotypes result in convergent sarcomeric proteoform profiles revealed by top-down proteomics.
Tucholski T, Cai W, Gregorich ZR, Bayne EF, Mitchell SD, McIlwain SJ, de Lange WJ, Wrobbel M, Karp H, Hite Z, Vikhorev PG, Marston SB, Lal S, Li A, Dos Remedios C, Kohmoto T, Hermsen J, Ralphe JC, Kamp TJ, Moss RL, Ge Y. Tucholski T, et al. Proc Natl Acad Sci U S A. 2020 Oct 6;117(40):24691-24700. doi: 10.1073/pnas.2006764117. Epub 2020 Sep 23. Proc Natl Acad Sci U S A. 2020. PMID: 32968017 Free PMC article. - Comprehensive Characterization of the Recombinant Catalytic Subunit of cAMP-Dependent Protein Kinase by Top-Down Mass Spectrometry.
Wu Z, Jin Y, Chen B, Gugger MK, Wilkinson-Johnson CL, Tiambeng TN, Jin S, Ge Y. Wu Z, et al. J Am Soc Mass Spectrom. 2019 Dec;30(12):2561-2570. doi: 10.1007/s13361-019-02341-0. Epub 2019 Dec 2. J Am Soc Mass Spectrom. 2019. PMID: 31792770 Free PMC article. - Comprehensive Characterization of Swine Cardiac Troponin T Proteoforms by Top-Down Mass Spectrometry.
Lin Z, Guo F, Gregorich ZR, Sun R, Zhang H, Hu Y, Shanmuganayagam D, Ge Y. Lin Z, et al. J Am Soc Mass Spectrom. 2018 Jun;29(6):1284-1294. doi: 10.1007/s13361-018-1925-y. Epub 2018 Apr 9. J Am Soc Mass Spectrom. 2018. PMID: 29633223 Free PMC article. - A Targeted, Differential Top-Down Proteomic Methodology for Comparison of ApoA-I Proteoforms in Individuals with High and Low HDL Efflux Capacity.
Seckler HDS, Fornelli L, Mutharasan RK, Thaxton CS, Fellers R, Daviglus M, Sniderman A, Rader D, Kelleher NL, Lloyd-Jones DM, Compton PD, Wilkins JT. Seckler HDS, et al. J Proteome Res. 2018 Jun 1;17(6):2156-2164. doi: 10.1021/acs.jproteome.8b00100. Epub 2018 Apr 27. J Proteome Res. 2018. PMID: 29649363 Free PMC article. - Effects of hypertension and exercise on cardiac proteome remodelling.
Petriz BA, Franco OL. Petriz BA, et al. Biomed Res Int. 2014;2014:634132. doi: 10.1155/2014/634132. Epub 2014 Apr 27. Biomed Res Int. 2014. PMID: 24877123 Free PMC article. Review.
References
- Mudd JO, Kass DA. Tackling heart failure in the twenty-first century. Nature. 2008;451(7181):919–928. - PubMed
- Yach D, Hawkes C, Gould CL, Hofman KJ. The global burden of chronic diseases - Overcoming impediments to prevention and control. J. Am. Med. Assoc. 2004;291(21):2616–2622. - PubMed
- de Couto G, Ouzounian M, Liu PP. Early detection of myocardial dysfunction and heart failure. Nat. Rev. Cardiol. 2010;7(6):334–344. - PubMed
- Surinova S, Schiess R, Hu¨ttenhain R, Cerciello F, Wollscheid B, Aebersold R. On the Development of Plasma Protein Biomarkers. J. Proteome Res. 2011;10:5–16. - PubMed
Publication types
MeSH terms
Substances
Grants and funding
- R37 HL082900-06/HL/NHLBI NIH HHS/United States
- R37 HL082900/HL/NHLBI NIH HHS/United States
- R01 HL096971/HL/NHLBI NIH HHS/United States
- R01 HL096971-01A2/HL/NHLBI NIH HHS/United States
- R37 HL82900/HL/NHLBI NIH HHS/United States
LinkOut - more resources
Full Text Sources
Other Literature Sources
Medical
Research Materials
Miscellaneous

