Abundance and diversity of mucosa-associated hydrogenotrophic microbes in the healthy human colon - PubMed (original) (raw)
Abundance and diversity of mucosa-associated hydrogenotrophic microbes in the healthy human colon
Gerardo M Nava et al. ISME J. 2012 Jan.
Abstract
Hydrogenotrophic microbiota have a significant impact on colonic health; however, little is known about their diversity and ecology in situ. Here, molecular-based methods and multivariate analyses were used to examine the abundance and diversity of mucosa-associated hydrogenotrophic microbes in 90 biopsies collected from right colon, left colon and rectum of 25 healthy subjects. Functional genes of all three hydrogenotrophic groups were detected in at least one colonic region of all subjects. Methanogenic archaea (MA) constituted approximately one half of the hydrogenotrophic microbiota in each colonic region. Sulfate-reducing bacteria (SRB) were more abundant than acetogens in right colon, while acetogens were more abundant than SRB in left colon and rectum. MA genotypes exhibited low diversity, whereas SRB genotypes were diverse and generally similar across the three regions within subject but significantly variable among subjects. Multivariate cluster analysis defined subject-specific patterns for the diversity of SRB genotypes; however, neither subject- nor region-specific clusters were observed for the abundance of hydrogenotrophic functional genes. Sequence analyses of functional gene clones revealed that mucosa-associated SRB were phylogenetically related to Desulfovibrio piger, Desulfovibrio desulfuricans and Bilophila wadsworthia; whereas MA were related to Methanobrevibacter spp., Mb. smithii and the order Methanomicrobiales. Together these data demonstrate for the first time that the human colonic mucosa is persistently colonized by all three groups of hydrogenotrophic microbes, which exhibit segmental and interindividual variation in abundance and diversity.
Figures
Figure 1
Quantification of acs, fhs, mcrA and dsrAB in right colon, left colon and rectal mucosa. Estimates of the abundance of acs, fhs, mcrA and dsrAB gene copies per gram of colonic tissue were determined by real-time PCR with a PCR product or plasmid dilution standard curve of the corresponding functional gene. Error bars indicate the s.e.m. of three technical replicates. MCA of the abundance of the four functional genes is presented in Supplementary Figure S1.
Figure 2
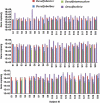
Quantification of SRB genera in right colon, left colon and rectal mucosa. Estimates of the abundance of Desulfobacter, Desulfobulbus, Desulfotomaculum/Desulfosporosinus and Desulfovibrio 16S rRNA gene copies per gram of colonic tissue were determined by real-time PCR with a PCR product dilution series standard curve of genomic DNA from corresponding type strains. Error bars indicate the s.e.m. of three technical replicates.
Figure 3
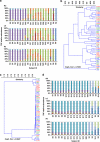
Individual T-RFLP profiles of Desulfovibrio 16S rRNA and dsrA gene sequences. A nested PCR T-RFLP approach was used to examine diversity in Desulfovibrio spp. 16S rRNA genes in mucosal biopsies from right colon (RC), left colon (LC) and rectum (Re). Relative abundance is demonstrated by terminal fragments recovered from the T-RFLP analysis using _Scr_fI endonuclease for Desulfovibrio 16S rRNA (a). Only TRFs that were present in at least two regions and representing >1% of the total profile signal are presented. Subjects are grouped according to similarities of TRF profiles. MCA of Desulfovibrio spp. 16S rRNA gene profiles across RC (red), LC (green) and Re (blue) was performed from the TRF profiles using Kulczynski (b) and Morisita (c) similarity indices. Cophenetic correlation coefficient (Coph Corr) values are shown. A similar nested PCR T-RFLP approach was used to examine diversity in dsrA using _Sau_96I endonuclease (d). MCAs of dsrA T-RFLP profiles are presented in Supplementary Figure S2.
Figure 4
Individual T-RFLP profiles of Archaea 16S rRNA and mcrA gene sequences. A nested PCR T-RFLP approach was used to examine diversity in Archaea 16S rRNA and mcrA genes in mucosal biopsies from right colon (RC), left colon (LC) and rectum (Re). Relative abundance is demonstrated by terminal fragments recovered from the T-RFLP analysis using _Hpy_188III endonuclease for Archaea 16S rRNA (a) and mcrA (d). Each color represents a terminal fragment and its proportion within each chart represents relative abundance. Regional similarities were estimated by means of MCA across RC (red), LC (green) and Re (blue) using Kulczynski (b) and Morisita (c) similarity indices.
Figure 5
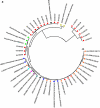
Phylogenetic affiliations of dsrA and mcrA clone sequences. Twenty-one clones of dsrA genes and nineteen clones of mcrA genes were recovered from colonic biopsies and sequenced. Phylogenetic tree reconstructions for dsrA (a) and mcrA (b) using the maximum parsimony and statistical significance of branch order (500 replications of bootstrapping) are shown. Red symbols represent the clones obtained in the present study. The scale bar represents the number of nucleotide substitutions per site.
Figure 6
Quantification of acs, fhs, mcrA and dsrAB in replicate biopsies from five additional subjects. Estimates of the abundance of acs, fhs, mcrA and dsrAB gene copies per gram of colonic tissue were determined by real-time PCR with a corresponding PCR product or plasmid dilution standard curve (a). Error bars indicate the s.e.m. of three technical replicates. MCA of acs, fhs, mcrA and dsrAB across the RC (red), LC (green) and Re (blue) was performed using the Morisita similarity index (b). Cophenetic correlation coefficient (Coph Corr) values are shown.
Similar articles
- On the relationship between sialomucin and sulfomucin expression and hydrogenotrophic microbes in the human colonic mucosa.
Croix JA, Carbonero F, Nava GM, Russell M, Greenberg E, Gaskins HR. Croix JA, et al. PLoS One. 2011;6(9):e24447. doi: 10.1371/journal.pone.0024447. Epub 2011 Sep 9. PLoS One. 2011. PMID: 21931721 Free PMC article. - Numerical ecology validates a biogeographical distribution and gender-based effect on mucosa-associated bacteria along the human colon.
Aguirre de Cárcer D, Cuív PO, Wang T, Kang S, Worthley D, Whitehall V, Gordon I, McSweeney C, Leggett B, Morrison M. Aguirre de Cárcer D, et al. ISME J. 2011 May;5(5):801-9. doi: 10.1038/ismej.2010.177. Epub 2010 Dec 2. ISME J. 2011. PMID: 21124491 Free PMC article. - Molecular ecological analysis of the succession and diversity of sulfate-reducing bacteria in the mouse gastrointestinal tract.
Deplancke B, Hristova KR, Oakley HA, McCracken VJ, Aminov R, Mackie RI, Gaskins HR. Deplancke B, et al. Appl Environ Microbiol. 2000 May;66(5):2166-74. doi: 10.1128/AEM.66.5.2166-2174.2000. Appl Environ Microbiol. 2000. PMID: 10788396 Free PMC article. - Archaea as emerging organisms in complex human microbiomes.
Dridi B, Raoult D, Drancourt M. Dridi B, et al. Anaerobe. 2011 Apr;17(2):56-63. doi: 10.1016/j.anaerobe.2011.03.001. Epub 2011 Mar 21. Anaerobe. 2011. PMID: 21420503 Review. - Laboratory tools for detection of archaea in humans.
Dridi B. Dridi B. Clin Microbiol Infect. 2012 Sep;18(9):825-33. doi: 10.1111/j.1469-0691.2012.03952.x. Clin Microbiol Infect. 2012. PMID: 22897827 Review.
Cited by
- Butyrate-producing Clostridium cluster XIVa species specifically colonize mucins in an in vitro gut model.
Van den Abbeele P, Belzer C, Goossens M, Kleerebezem M, De Vos WM, Thas O, De Weirdt R, Kerckhof FM, Van de Wiele T. Van den Abbeele P, et al. ISME J. 2013 May;7(5):949-61. doi: 10.1038/ismej.2012.158. Epub 2012 Dec 13. ISME J. 2013. PMID: 23235287 Free PMC article. - Understanding the microbiome: a primer on the role of the microbiome in colorectal neoplasia.
Watson KM, Gaulke CA, Tsikitis VL. Watson KM, et al. Ann Gastroenterol. 2020 May-Jun;33(3):223-236. doi: 10.20524/aog.2020.0467. Epub 2020 Mar 14. Ann Gastroenterol. 2020. PMID: 32382225 Free PMC article. Review. - An Expanded Genetic Code Enables Trimethylamine Metabolism in Human Gut Bacteria.
Kivenson V, Giovannoni SJ. Kivenson V, et al. mSystems. 2020 Oct 27;5(5):e00413-20. doi: 10.1128/mSystems.00413-20. mSystems. 2020. PMID: 33109749 Free PMC article. - Colonisation of the colonic mucus gel layer with butyrogenic and hydrogenotropic bacteria in health and ulcerative colitis.
Earley H, Lennon G, Coffey JC, Winter DC, O'Connell PR. Earley H, et al. Sci Rep. 2021 Mar 31;11(1):7262. doi: 10.1038/s41598-021-86166-6. Sci Rep. 2021. PMID: 33790336 Free PMC article. Clinical Trial. - The smallest active carbamoyl phosphate synthetase was identified in the human gut archaeon Methanobrevibacter smithii.
Popa E, Perera N, Kibédi-Szabó CZ, Guy-Evans H, Evans DR, Purcarea C. Popa E, et al. J Mol Microbiol Biotechnol. 2012;22(5):287-99. doi: 10.1159/000342520. Epub 2012 Oct 27. J Mol Microbiol Biotechnol. 2012. PMID: 23107800 Free PMC article.
References
- Anderson MJ, Crist TO, Chase JM, Vellend M, Inouye BD, Freestone AL, et al. Navigating the multiple meanings of beta diversity: a roadmap for the practicing ecologist. Ecol Lett. 2011;14:19–28. - PubMed
- Attene-Ramos MS, Wagner ED, Plewa MJ, Gaskins HR. Evidence that hydrogen sulfide is a genotoxic agent. Mol Cancer Res. 2006;4:9–14. - PubMed
- Bakke I, De Schryver P, Boon N, Vadstein O. PCR-based community structure studies of bacteria associated with eukaryotic organisms: a simple PCR strategy to avoid co-amplification of eukaryotic DNA. J Microbiol Methods. 2011;84:349–351. - PubMed
- Barneah O, Ben-Dov E, Kramarsky-Winter E, Kushmaro A. Characterization of black band disease in Red Sea stony corals. Environ Microbiol. 2007;9:1995–2006. - PubMed
Publication types
MeSH terms
LinkOut - more resources
Full Text Sources
Miscellaneous


