A new paramagnetic intermediate formed during the reaction of nitrite with deoxyhemoglobin - PubMed (original) (raw)
. 2011 Aug 24;133(33):13010-22.
doi: 10.1021/ja1115088. Epub 2011 Aug 2.
Affiliations
- PMID: 21755997
- PMCID: PMC3166623
- DOI: 10.1021/ja1115088
A new paramagnetic intermediate formed during the reaction of nitrite with deoxyhemoglobin
Maria T Salgado et al. J Am Chem Soc. 2011.
Abstract
The reduction of nitrite by deoxygenated hemoglobin chains has been implicated in red cell-induced vasodilation, although the mechanism for this process has not been established. We have previously demonstrated that the reaction of nitrite with deoxyhemoglobin produces a hybrid intermediate with properties of Hb(II)NO(+) and Hb(III)NO that builds up during the reaction retaining potential NO bioactivity. To explain the unexpected stability of this intermediate, which prevents NO release from the Hb(III)NO component, we had implicated the transfer of an electron from the β-93 thiol to NO(+) producing ·SHb(II)NO. To determine if this species is formed and to characterize its properties, we have investigated the electron paramagnetic resonance (EPR) changes taking place during the nitrite reaction. The EPR effects of blocking the thiol group with N-ethyl-maleimide and using carboxypeptidase-A to stabilize the R-quaternary conformation have demonstrated that ·SHb(II)NO is formed and that it has the EPR spectrum expected for NO bound to the heme in the β-chain plus that of a thiyl radical. This new NO-related paramagnetic species is in equilibrium with the hybrid intermediate "Hb(II)NO(+) ↔ Hb(III)NO", thereby further inhibiting the release of NO from Hb(III)NO. The formation of an NO-related paramagnetic species other than the tightly bound NO in Hb(II)NO was also confirmed by a decrease in the EPR signal by -20 °C incubation, which shifts the equilibrium back to the "Hb(II)NO(+) ↔ Hb(III)NO" intermediate. This previously unrecognized NO hemoglobin species explains the stability of the intermediates and the buildup of a pool of potentially bioactive NO during nitrite reduction. It also provides a pathway for the formation of β-93 cysteine S-nitrosylated hemoglobin [SNOHb:S-nitrosohemoglobin], which has been shown to induce vasodilation, by a rapid radical-radical reaction of any free NO with the thiyl radical of this new paramagnetic intermediate.
Figures
Figure 1
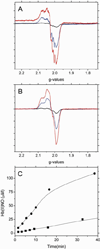
The X-band EPR spectra of Hb(II)NO formed as a function of reaction time when (A) 1mM deoxyHb or (B) 1mM NEM treated deoxyHb are both reacted with 0.25 mM nitrite under anaerobic conditions. (black: 1min; blue: 15min; red: 60min). (C) Total Hb(II)NO concentration as a function of reaction time for non-NEM (■) and NEM treated deoxyHb (●) reacted with nitrite. EPR spectra were recorded at 10 K.
Figure 2
Relative increase in Hb(II)NO concentration relative to control for deoxyHb (control), NEM treated, CPA treated and CPA and NEM treated deoxyHb reacted with nitrite for 60min. (Heme:nitrite ratio is 4:1).
Figure 3
The X-band EPR spectra in the g=2 region for (A) 1mM NEM treated deoxyHb and (B) 1mM deoxyHb both reacted with 0.25 mM nitrite for 60min (-·-) and then incubated at −20°C for 10min (—). EPR spectra were recorded at 10 K.
Figure 4
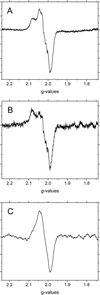
The X-band EPR spectra in the g=2 region for (A) CPA treated deoxyHb and (B) CPA/NEM treated deoxyHb both reacted with nitrite for 60min. (Heme:nitrite ratio is 4:1). (C) The difference EPR spectrum obtained by subtracting the CPA/NEM spectra (4B) from the CPA spectra (4A) after normalization for the intensity differences. EPR spectra were recorded at 10 K.
Figure 5
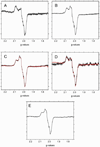
The X-band EPR spectra in the g=2 region for (A) R-state Hb(II)αNO from semihemoglobin. (B) R-state Hb(II)βNO from semihemoglobin. Spectral fits of nitrite reacted (C) CPA treated deoxyHb and (D) CPA/NEM treated deoxyHb at 60min. (Heme:nitrite ratio is 4:1). (black: observed spectra; red: calculated spectra). [These spectra were fitted using fractions of R-state Hb(II)βNO (Fig. 5A) and R-state Hb(II)αNO (Fig. 5B) and the thiyl radical species (Fig. 4C). (E) The paramagnetic intermediate spectrum calculated from a summation of the thiyl radical spectrum (Fig. 4C) and 0.43 times the R-state Hb(II)βNO spectrum (Fig. 5B) (see text). EPR spectra were recorded at 10 K. Calculated DI vs. Experimental DI: CPA calculated DI: 1.19e, experimental DI: 1.17e, % error: 2.0% CPA/NEM calculated DI: 1.81e, experimental DI: 1.72e, % error: 5.0%.
Figure 6
The X-band EPR spectra in the g=2 region for (A) 1mM deoxyHb reacted with (black) 0.25 mM nitrite, (blue) 1mM azide before 0.25 mM nitrite addition, and (red) 1mM azide after 0.25 mM nitrite addition for 60 min. (B) The spectral components that make up the calculated EPR spectra of (A). (black: R-state Hb(II)NO, red: R-state Hb(II)βNO, blue: T-state Hb(II)αNO, orange: T-state Hb(II)βNO and green: thiyl radical). [Azide to heme ratio was 1:1. Note: azide has EPR signals at g=2.84, 2.20 and 1.69. These signals do not interact with the heme-NO signal at g=2.0]. Calculated DI vs. Experimental DI: deoxy/nitrite calculated DI: 9.40e7, experimental DI: 8.38e7, % error: 12.2% deoxy/azide/nitrite calculated DI: 6.57e, experimental DI: 5.87e, % error: 11.8% deoxy/nitrite/azide calculated DI: 1.04e, experimental DI:1.07e, % error: 9.72%
Figure 7
The spectral components that make up the calculated EPR spectra of the signal in the g=2 region when (A) 1mM deoxyHb and 0.25mM nitrite are reacted for 1, 15 and 60 min; (B) 1mM NEM treated deoxyHb and 0.25mM nitrite are reacted for 1, 15 and 60 min. (black: R-state Hb(II)NO; red: R-state Hb(II)βNO; blue: T-state Hb(II)αNO; orange: T-state Hb(II)βNO; green: thiyl radical). Calculated DI vs. Experimental DI: (A) 1 min calculated DI: 8.08e, experimental DI: 1.057e, % error: 23.3%; 15 min calculated DI: 6.10e, experimental DI: 7.01e, % error: 13.0%; 60 min calculated DI: 1.08e, experimental DI: 9.30e, % error: 16.6%. (B) 1 min calculated DI: 6.89e, experimental DI: 7.31e, % error: 5.83%; 15 min calculated DI: 3.30e, experimental DI: 3.75e, % error: 11.9%; 60 min calculated DI: 4.11e, experimental DI: 4.32e, % error: 4.85%.
Figure 8
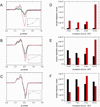
The X-band EPR spectra in the g=2 region for a 1mM deoxyHb and 0.25 mM nitrite mixture reacted for (A) 1 min; (B) 15 min; (C) 60 min (black), incubated at −20 °C for 1 (green); 5 (blue); 10 (red) min. [Insets: represent the change in signal intensity in the g=2 region versus incubation time]. The changes in the spectral components as a function of incubation time at −20 °C for the corresponding calculated EPR spectra for the 1 min (D); 15 min (E); and 60 min (F) reaction mixtures. (black: R-state Hb(II)NO; red: R-state Hb(II)βNO; blue: T-state Hb(II)αNO; orange: T-state Hb(II)βNO; green: thiyl radical). Calculated DI vs. Experimental DI: (D) 1min reaction time: 1 min incubation calculated DI: 6.03e, experimental DI: 7.85e, % error: 23.1%; 5 min incubation calculated DI: 1.24e, experimental DI: 1.60e, % error: 22.6%; 10 min incubation calculated DI: 2.24e, experimental DI: 2.67e, % error: 16.2%. (E) 15min reaction time: 1 min incubation calculated DI: 3.58e, experimental DI: 4.25e, % error: 15.9%; 5 min incubation calculated DI: 4.73e, experimental DI: 5.80e, % error: 18.4%; 10 min incubation calculated DI: 4.37e, experimental DI: 5.20e, % error: 16.0%. (F) 60min reaction time: 1 min incubation calculated DI: 6.09e, experimental DI: 6.93e, % error: 12.2%; 5 min incubation calculated DI: 5.88e, experimental DI: 7.84e, % error: 25.0%; 10 min incubation calculated DI: 5.05e, experimental DI: 6.28e, % error: 19.5%.
Figure 9
The X-band EPR spectra in the g=2 region for a 1mM NEM treated deoxyHb and 0.25 mM nitrite mixture reacted for (A) 1 min; (B) 15 min; (C) 60 min (black), incubated at −20 °C for 1 (green); 5 (blue); 10 (red) min. [Insets: represent the change in signal intensity in the g=2 region versus incubation time]. The changes in the spectral components as a function of incubation time at −20 °C for the corresponding calculated EPR spectra for the 1 min (D); 15 min (E); and 60 min (F) reaction mixtures. (black: R-state Hb(II)NO; red: R-state Hb(II)βNO). Calculated DI vs. Experimental DI: (D) 1min reaction time: 1 min incubation calculated DI: 5.36e, experimental DI: 7.31e, % error: 25.7%; 5 min incubation calculated DI: 9.74e, experimental DI: 1.23e, % error: 20.7%; 10 min incubation calculated DI: 2.22e, experimental DI: 2.84e, % error: 21.7%. (E) 15min reaction time: 1 min incubation calculated DI: 2.91e, experimental DI: 3.28e, % error: 11.1%; 5 min incubation calculated DI: 4.39e, experimental DI: 5.38e, % error: 18.4%; 10 min incubation calculated DI: 5.37e, experimental DI: 7.35e, % error: 25.9%. (F) 60min reaction time: 1 min incubation calculated DI: 4.88e, experimental DI: 5.56e, % error: 4.85%; 5 min incubation calculated DI: 5.75e, experimental DI: 7.34e, % error: 21.7%; 10 min incubation calculated DI: 4.62e, experimental DI: 5.31e, % error: 13.0%.
Similar articles
- S-nitrosohemoglobin: a mechanism for its formation in conjunction with nitrite reduction by deoxyhemoglobin.
Nagababu E, Ramasamy S, Rifkind JM. Nagababu E, et al. Nitric Oxide. 2006 Aug;15(1):20-9. doi: 10.1016/j.niox.2006.01.012. Epub 2006 Mar 20. Nitric Oxide. 2006. PMID: 16545588 - Quantification of intermediates formed during the reduction of nitrite by deoxyhemoglobin.
Salgado MT, Nagababu E, Rifkind JM. Salgado MT, et al. J Biol Chem. 2009 May 8;284(19):12710-8. doi: 10.1074/jbc.M808647200. Epub 2009 Mar 7. J Biol Chem. 2009. PMID: 19270306 Free PMC article. - Red blood cell membrane-facilitated release of nitrite-derived nitric oxide bioactivity.
Salgado MT, Cao Z, Nagababu E, Mohanty JG, Rifkind JM. Salgado MT, et al. Biochemistry. 2015 Nov 10;54(44):6712-23. doi: 10.1021/acs.biochem.5b00643. Epub 2015 Oct 28. Biochemistry. 2015. PMID: 26478948 - The new chemical biology of nitrite reactions with hemoglobin: R-state catalysis, oxidative denitrosylation, and nitrite reductase/anhydrase.
Gladwin MT, Grubina R, Doyle MP. Gladwin MT, et al. Acc Chem Res. 2009 Jan 20;42(1):157-67. doi: 10.1021/ar800089j. Acc Chem Res. 2009. PMID: 18783254 Review. - The functional nitrite reductase activity of the heme-globins.
Gladwin MT, Kim-Shapiro DB. Gladwin MT, et al. Blood. 2008 Oct 1;112(7):2636-47. doi: 10.1182/blood-2008-01-115261. Epub 2008 Jul 2. Blood. 2008. PMID: 18596228 Free PMC article. Review.
Cited by
- Hemoglobin redox reactions and red blood cell aging.
Rifkind JM, Nagababu E. Rifkind JM, et al. Antioxid Redox Signal. 2013 Jun 10;18(17):2274-83. doi: 10.1089/ars.2012.4867. Epub 2012 Nov 9. Antioxid Redox Signal. 2013. PMID: 23025272 Free PMC article. Review. - S-nitrosylation therapy to improve oxygen delivery of banked blood.
Reynolds JD, Bennett KM, Cina AJ, Diesen DL, Henderson MB, Matto F, Plante A, Williamson RA, Zandinejad K, Demchenko IT, Hess DT, Piantadosi CA, Stamler JS. Reynolds JD, et al. Proc Natl Acad Sci U S A. 2013 Jul 9;110(28):11529-34. doi: 10.1073/pnas.1306489110. Epub 2013 Jun 24. Proc Natl Acad Sci U S A. 2013. PMID: 23798386 Free PMC article. - Nitric oxide formation versus scavenging: the red blood cell balancing act.
Owusu BY, Stapley R, Patel RP. Owusu BY, et al. J Physiol. 2012 Oct 15;590(20):4993-5000. doi: 10.1113/jphysiol.2012.234906. Epub 2012 Jun 11. J Physiol. 2012. PMID: 22687616 Free PMC article. Review. - Evidence for a cysteine-mediated mechanism of excitation energy regulation in a photosynthetic antenna complex.
Orf GS, Saer RG, Niedzwiedzki DM, Zhang H, McIntosh CL, Schultz JW, Mirica LM, Blankenship RE. Orf GS, et al. Proc Natl Acad Sci U S A. 2016 Aug 2;113(31):E4486-93. doi: 10.1073/pnas.1603330113. Epub 2016 Jun 22. Proc Natl Acad Sci U S A. 2016. PMID: 27335466 Free PMC article. - Hypoxic vasodilatory defect and pulmonary hypertension in mice lacking hemoglobin β-cysteine93 S-nitrosylation.
Zhang R, Hausladen A, Qian Z, Liao X, Premont RT, Stamler JS. Zhang R, et al. JCI Insight. 2022 Feb 8;7(3):e155234. doi: 10.1172/jci.insight.155234. JCI Insight. 2022. PMID: 34914637 Free PMC article.
References
- Palmer RM, Ferrige AG, Moncada S. Nature. 1987;327(6122):524–526. - PubMed
- Ignarro LJ. J. Physiol Pharmacol. 2002;53(4 Pt 1):503–514. - PubMed
- Palmer RM, Ashton DS, Moncada S. Nature. 1988;333(6174):664–666. - PubMed
- Denninger JW, Marletta MA. Biochim. Biophys. Acta. 1999;1411(2–3):334–350. - PubMed
Publication types
MeSH terms
Substances
LinkOut - more resources
Full Text Sources


