An adaptation of the Wiener filter suitable for analyzing images of isolated single particles - PubMed (original) (raw)
An adaptation of the Wiener filter suitable for analyzing images of isolated single particles
Charles V Sindelar et al. J Struct Biol. 2011 Oct.
Abstract
The Wiener filter is a standard means of optimizing the signal in sums of aligned, noisy images obtained by electron cryo-microscopy (cryo-EM). However, estimation of the resolution-dependent ("spectral") signal-to-noise ratio (SSNR) from the input data has remained problematic, and error reduction due to specific application of the SSNR term within a Wiener filter has not been reported. Here we describe an adjustment to the Wiener filter for optimal summation of images of isolated particles surrounded by large regions of featureless background, as is typically the case in single-particle cryo-EM applications. We show that the density within the particle area can be optimized, in the least-squares sense, by scaling the SSNR term found in the conventional Wiener filter by a factor that reflects the fraction of the image field occupied by the particle. We also give related expressions that allow the SSNR to be computed for application in this new filter, by incorporating a masking step into a Fourier Ring Correlation (FRC), a standard resolution measure. Furthermore, we show that this masked FRC estimation scheme substantially improves on the accuracy of conventional SSNR estimation methods. We demonstrate the validity of our new approach in numeric tests with simulated data corresponding to realistic cryo-EM imaging conditions. This variation of the Wiener filter and accompanying derivation should prove useful for a variety of single-particle cryo-EM applications, including 3D reconstruction.
Copyright © 2011 Elsevier Inc. All rights reserved.
Figures
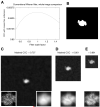
Figure 1. FRC calculations for isolated single particles depend on image size
(A) Noise-free projection image of PDB model 1MJK (256 × 256 pixels). In this figure and all following, pixel values are scaled for maximum visual contrast within each image; these scale factors thus vary somewhat from image to image. (B) Projection image from A with white noise subsequently added to achieve a whole-image SNR of 0.003. Image is reduced in scale relative to A, and is 512 × 512 pixels in size. Dashed rectangles indicate 256×256 and 128×128 boundary boxes. (C) SSNRno CTF characteristic of the noisy image in B, for various image sizes. (D) Graphs of the FRC calculated between two independent straight averages of 50 noisy images (as in B). Three graphs indicate the results of the calculation for the three different image sizes shown in B.
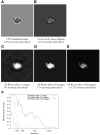
Figure 2. Image restoration of a synthetic single-particle image using a conventional Wiener filter
(A) Results of whole-image cross-correlation comparison between the noise-free reference image (Fig. 1A) and a Wiener-filtered composite of 100 256×256-pixel noisy images, each noisy image having a SNR of 0.003 but no CTF applied (as in Fig. 1B). In this figure, the SSNR term in the Wiener filter (Equation (4) ) has been varied above and below its known value in the image data set by multiplication with a scalar factor (“filter scale factor”), such that each x-value represents a slightly different incarnation of the filter and x=1 corresponds to the “true” Wiener filter. Note that in this plot the single-particle Wiener filter would correspond to a “filter scale factor” of 1/0.0328 = 30.5, for which the masked correlation to the perfect image was found to be 0.66 (not visible on the scale shown here). Inset in the lower right corner shows a magnified view of the particle region; inset in lower left corner shows the identical view of the noise-free particle, for comparison. (B) Tight binary envelope function generated from the noise-free image in Fig. 1A. Inset is as in A. (C) – (E) Output of the conventional Wiener filter for sets of 100 noisy images as in Fig. 1B, for the three different box sizes. Note that CCCmask-ref = 0.929 for the SP Wiener filter reconstruction. Inset is as in A.
Figure 3. re-localization of signal intensity by single-particle Wiener filtering applied to a defocus series of images
(A) Noise-free, CTF-modulated image (defocus is 1.4μm) (B) Signal restoration achieved by phase flipping the image in B. (C) Signal restoration achieved by applying a single-particle Wiener filter to the image in B. The Wiener filter is implemented for the specific case of white noise, added to produce a net SNR of 0.003. (D) Signal restoration achieved by applying a single-particle Wiener filter to a series of 10 randomly defocused images as in B (defocus range 1μm to 2μm), for the same SNR condition as in D. (E) Signal restoration as in E but for a series of 100 images. (F) Plotted is the ratio of the squared power spectrum to the noise-free power spectrum for a series of single-particle Wiener noisy image restorations, as a function of resolution. These plots give the effective transfer function (or filtering function) that is applied to the “perfect” image signal (independent of the noise) during image restoration.
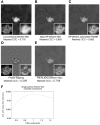
Figure 4. Image restoration using the single-particle Wiener filter
(A) Image restoration of the CTF-corrupted 100-image series as achieved by the conventional Wiener filter_;_ random defocus variations between 1 and 2 microns were applied to the image series. (B) Similar to A but using the single-particle Wiener filter, applying the known PSSNR function (Fig. 1C). Insets in this and subsequent panels follow the scheme of Fig. 2. (C) Similar to A, but using the single-particle Wiener filter, and applying the estimated PSSNR function (see Fig. 5). (D) Similar to A, but image restoration achieved by phase-flipping. (E) Similar to A, but image restoration achieved by dividing the noisy images by the CTF before summation. (F_)_ Masked cross-correlation agreement between the Wiener-filtered composite image D and the noise-free image A, for a series of modified Wiener filters where the PSSNR input to the filter was adjusted upwards or downwards by a scalar factor (x-axis). Note that in this graph, the conventional Wiener filter would correspond to a “filter scale factor” of 0.0328 (the mean squared value of the binary mask function depicted in Fig. 2A, see text). The conventional Wiener filter result is therefore off the scale in this graph; the masked correlation to the perfect image for this latter condition was 0.77.
Figure 5. Estimation of the PSSNR from masked FRC calculations
A. FRC calculations for a 100-image data set (as in Fig. 2), split into halves and averaged to produce two noisy particle estimates. In the masked FRC calculations, we applied either a binary mask (identical to Figure 3B) or a smoothed mask. The smoothed mask was obtained by expanding the border of the binary mask with a cosine-edge smoothing function (Grigorieff, 2007) such that 〈env2〉 increased by approximately 50%. B. FRC calculations from A, but with the smoothed-mask calculation rescaled by Equation (19). C. FRC calculations from A, but with the non-masked calculation rescaled by Equation (19).
Similar articles
- Optimal noise reduction in 3D reconstructions of single particles using a volume-normalized filter.
Sindelar CV, Grigorieff N. Sindelar CV, et al. J Struct Biol. 2012 Oct;180(1):26-38. doi: 10.1016/j.jsb.2012.05.005. Epub 2012 May 18. J Struct Biol. 2012. PMID: 22613568 Free PMC article. - [Progress in filters for denoising cryo-electron microscopy images].
Huang XR, Li S, Gao S. Huang XR, et al. Beijing Da Xue Xue Bao Yi Xue Ban. 2021 Mar 3;53(2):425-433. doi: 10.19723/j.issn.1671-167X.2021.02.033. Beijing Da Xue Xue Bao Yi Xue Ban. 2021. PMID: 33879921 Free PMC article. Chinese. - Denoising and covariance estimation of single particle cryo-EM images.
Bhamre T, Zhang T, Singer A. Bhamre T, et al. J Struct Biol. 2016 Jul;195(1):72-81. doi: 10.1016/j.jsb.2016.04.013. Epub 2016 Apr 27. J Struct Biol. 2016. PMID: 27129418 Free PMC article. - Tools for visualizing and analyzing Fourier space sampling in Cryo-EM.
Baldwin PR, Lyumkis D. Baldwin PR, et al. Prog Biophys Mol Biol. 2021 Mar;160:53-65. doi: 10.1016/j.pbiomolbio.2020.06.003. Epub 2020 Jul 6. Prog Biophys Mol Biol. 2021. PMID: 32645314 Free PMC article. Review. - Cryo-Electron Tomography and Subtomogram Averaging.
Wan W, Briggs JA. Wan W, et al. Methods Enzymol. 2016;579:329-67. doi: 10.1016/bs.mie.2016.04.014. Epub 2016 Jun 22. Methods Enzymol. 2016. PMID: 27572733 Review.
Cited by
- Structures of yeast 80S ribosome-tRNA complexes in the rotated and nonrotated conformations.
Svidritskiy E, Brilot AF, Koh CS, Grigorieff N, Korostelev AA. Svidritskiy E, et al. Structure. 2014 Aug 5;22(8):1210-1218. doi: 10.1016/j.str.2014.06.003. Epub 2014 Jul 17. Structure. 2014. PMID: 25043550 Free PMC article. - Principles of cryo-EM single-particle image processing.
Sigworth FJ. Sigworth FJ. Microscopy (Oxf). 2016 Feb;65(1):57-67. doi: 10.1093/jmicro/dfv370. Epub 2015 Dec 24. Microscopy (Oxf). 2016. PMID: 26705325 Free PMC article. Review. - Subnanometer-resolution structure determination in situ by hybrid subtomogram averaging - single particle cryo-EM.
Sanchez RM, Zhang Y, Chen W, Dietrich L, Kudryashev M. Sanchez RM, et al. Nat Commun. 2020 Jul 24;11(1):3709. doi: 10.1038/s41467-020-17466-0. Nat Commun. 2020. PMID: 32709843 Free PMC article. - Ab-initio contrast estimation and denoising of cryo-EM images.
Shi Y, Singer A. Shi Y, et al. Comput Methods Programs Biomed. 2022 Sep;224:107018. doi: 10.1016/j.cmpb.2022.107018. Epub 2022 Jul 15. Comput Methods Programs Biomed. 2022. PMID: 35901641 Free PMC article. - Optimal noise reduction in 3D reconstructions of single particles using a volume-normalized filter.
Sindelar CV, Grigorieff N. Sindelar CV, et al. J Struct Biol. 2012 Oct;180(1):26-38. doi: 10.1016/j.jsb.2012.05.005. Epub 2012 May 18. J Struct Biol. 2012. PMID: 22613568 Free PMC article.
References
- Danev R, Nagayama K. Phase plates for transmission electron microscopy. Meth. Enzymol. 2010;481:343–369. - PubMed
- Frank J, Al-Ali L. Signal-to-noise ratio of electron micrographs obtained by cross correlation. Nature. 1975;256:376–379. - PubMed
- Frank J, Radermacher M, Penczek P, Zhu J, Li Y, et al. SPIDER and WEB: processing and visualization of images in 3D electron microscopy and related fields. J. Struct. Biol. 1996;116:190–199. - PubMed
Publication types
MeSH terms
Grants and funding
- HHMI_/Howard Hughes Medical Institute/United States
- P01 GM062580/GM/NIGMS NIH HHS/United States
- P01 GM062580-10/GM/NIGMS NIH HHS/United States
- P01 GM-623580/GM/NIGMS NIH HHS/United States
LinkOut - more resources
Full Text Sources


