Suppressor of cytokine signaling (SOCS) 1 inhibits type I interferon (IFN) signaling via the interferon alpha receptor (IFNAR1)-associated tyrosine kinase Tyk2 - PubMed (original) (raw)
Suppressor of cytokine signaling (SOCS) 1 inhibits type I interferon (IFN) signaling via the interferon alpha receptor (IFNAR1)-associated tyrosine kinase Tyk2
Rebecca A R Piganis et al. J Biol Chem. 2011.
Abstract
Type I IFNs are critical players in host innate and adaptive immunity. IFN signaling is tightly controlled to ensure appropriate immune responses as imbalance could result in uncontrolled inflammation or inadequate responses to infection. It is therefore important to understand how type I IFN signaling is regulated. Here we have investigated the mechanism by which suppressor of cytokine signaling 1 (SOCS1) inhibits type I IFN signaling. We have found that SOCS1 inhibits type I IFN signaling not via a direct interaction with the IFN α receptor 1 (IFNAR1) receptor component but through an interaction with the IFNAR1-associated kinase Tyk2. We have characterized the residues/regions involved in the interaction between SOCS1 and Tyk2 and found that SOCS1 associates via its SH2 domain with conserved phosphotyrosines 1054 and 1055 of Tyk2. The kinase inhibitory region of SOCS1 is also essential for its interaction with Tyk2 and inhibition of IFN signaling. We also found that Tyk2 is preferentially Lys-63 polyubiquitinated and that this activation reaction is inhibited by SOCS1. The consequent effect of SOCS1 inhibition of Tyk2 not only results in a reduced IFN response because of inhibition of Tyk2 kinase-mediated STAT signaling but also negatively impacts IFNAR1 surface expression, which is stabilized by Tyk2.
Figures
FIGURE 1.
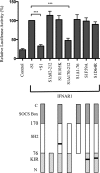
Effect of SOCS1 variants on type I IFN signaling. The histogram shows the relative expression of an ISRE-luciferase reporter in IFNAR1−/− MEFs transiently cotransfected with mu-IFNAR1 and either mu-SOCS1, SOCS1Δ82–212, SOCS1R105K, SOCS1Δ170–212, SOCS1Δ1–76, SOCS1F59A, or SOCS1D64R (represented diagrammatically in the lower panel). C represents the carboxy terminal, and N represents the amino terminal. Cells were stimulated with 50 IU/ml mu-IFNα for 7 h prior to luciferase readings. Luciferase activity is normalized against a TK-Renilla reporter to control for transfection efficiency and then expressed as a percentage of activity in the absence of SOCS1 (-S1), which is denoted as 100%. Addition of SOCS1 resulted in almost complete inhibition of IFN activity to control levels. Data are expressed as mean ± S.E. of three experiments. ***, p < 0.001.
FIGURE 2.
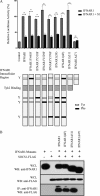
Mapping IFNAR1 domains critical for interaction with SOCS1. A, the histogram shows relative expression of an ISRE-luciferase reporter in IFNAR1−/− MEFs transiently cotransfected with either mu-IFNAR1, IFNAR1Y445F, IFNAR1Y518F, IFNAR1Y529F, IFNAR1Y576F, IFNAR1Y518F/Y529F/Y576F(3F), IFNAR1Y445F/Y518F/Y529F/Y576F(4F) IFNAR1Δ511, or IFNAR1Δ471 (represented diagrammatically in the lower panel) with or without mu-SOCS1. Y denotes tyrosine residues. Cells were stimulated with 50 IU/ml mu-IFNα for 7 h prior to luciferase readings. Luciferase activity is normalized against a TK-Renilla reporter to control for transfection efficiency and is expressed relative to wild-type IFNAR1 in the absence of SOCS1, which is denoted as 100%. Data are represented as mean ± S.E. of three experiments. ***, p < 0.001. B, immunoprecipitation (IP) Western blot analyses (WB) of IFNAR1 mutants and SOCS1. IFNAR1, IFNAR1(4F), IFNAR1Δ 511, or IFNAR1Δ471 were cotransfected with SOCS1-FLAG into HEK293T cells. Following expression, immunoprecipitation of IFNAR1 or the IFNAR1 mutants was performed using anti-IFNAR1 antibody. Immunoprecipitates and whole cell lysates (WCL) were separated by SDS-PAGE and immunoblotted with anti-FLAG to detect SOCS1-FLAG. Blots are representative of triplicate experiments.
FIGURE 3.
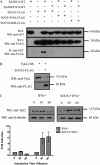
Interaction of SOCS1 with Tyk2 and its degradation. Western blot analyses (WB) and immunoprecipitation (IP) Western blot analyses of Tyk2 interacting with SOCS1. A, Tyk2KD or Tyk2KD(2F) were cotransfected with SOCS1-FLAG, SOCS1F59A-FLAG, or SOCS1D64R-FLAG into HEK293T cells. Following expression, immunoprecipitation of Tyk2 constructs were performed using glutathione-Sepharose beads. Immunoprecipitates and whole cell lysates (WCL) were separated by SDS-PAGE and immunoblotted with indicated antibodies. B, Tyk2-HIS was expressed ± SOCS1-FLAG in HEK293T cells. Cells lysates were separated by SDS-PAGE and probed with the indicated antibodies. C, thymocytes from SOCS1+/+IFNγ−/− and SOCS1−/−IFNγ−/− mice were stimulated with IFNα for 0, 30, or 60 min. Cell lysates were separated by SDS-PAGE and probed with the indicated antibodies. Blots are representative of triplicate experiments. The histogram represents densitometric quantification of the Western blot analyses. Data are represented as mean ± S.E. of three independent experiments.
FIGURE 4.
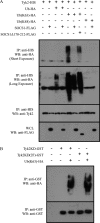
The effect of SOCS1 on Tyk2 ubiquitination. Western blots analyses (WB) and immunoprecipitation (IP) Western blot analyses of Tyk2 ubiquitination. A, Tyk2-HIS was expressed in HEK293T cells with ubiquitin-HA, ubiquitin(K63)-HA, or ubiquitin(K48)-HA ± SOCS1-FLAG or SOCS1Δ170–212 in the presence of MG132. Cell lysates were immunoprecipitated with nickel affinity beads. Immunoprecipitates and whole cell lysates (WCL) were separated by SDS-PAGE and probed with the indicated antibodies. The second panel from the top shows a shorter exposure than the top panel. Tyk2 ubiquitination is shown in the top panel, third lane, and Lys-63 ubiquitination in the top panel and the second panel from the top, fifth lane. Inhibition by SOCS1 constructs is evident in the fourth lane (top panel) and the sixth and seventh lanes (top panel or second panel from the top). B, Tyk2KD-GST or Tyk2KD(2F)-GST were expressed in HEK293T cells ± ubiquitin-HA. Cell lysates were immunoprecipitated with glutathione beads. Immunoprecipitates were separated by SDS-PAGE and probed with the indicated antibodies. Blots are representative of triplicate experiments.
FIGURE 5.
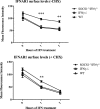
The effect of SOCS1 on surface levels of IFNAR1. The graphs show IFNAR1 surface levels on thymocytes from SOCS1+/+IFNγ−/−, SOCS1−/−IFNγ−/−, and wild-type mice stimulated with IFNα for 0, 1, or 2 h. Cells were probed with anti-IFNAR1 antibody and analyzed by flow cytometry to detect IFNAR1 surface levels in the presence and absence of cycloheximide (CHX). Data are represented as mean ± S.E. of four experiments. ***, p < 0.001; **, p < 0.005.
Similar articles
- Re-examination of the role of suppressor of cytokine signaling 1 (SOCS1) in the regulation of toll-like receptor signaling.
Gingras S, Parganas E, de Pauw A, Ihle JN, Murray PJ. Gingras S, et al. J Biol Chem. 2004 Dec 24;279(52):54702-7. doi: 10.1074/jbc.M411043200. Epub 2004 Oct 18. J Biol Chem. 2004. PMID: 15491990 - The SOCS1 KIR and SH2 domain are both required for suppression of cytokine signaling in vivo.
Doggett K, Keating N, Dehkhoda F, Bidgood GM, Meza Guzman LG, Leong E, Kueh A, Nicola NA, Kershaw NJ, Babon JJ, Alexander WS, Nicholson SE. Doggett K, et al. Cytokine. 2023 May;165:156167. doi: 10.1016/j.cyto.2023.156167. Epub 2023 Mar 17. Cytokine. 2023. PMID: 36934508 - Functional conservation of suppressors of cytokine signaling proteins between teleosts and mammals: Atlantic salmon SOCS1 binds to JAK/STAT family members and suppresses type I and II IFN signaling.
Skjesol A, Liebe T, Iliev DB, Thomassen EI, Tollersrud LG, Sobhkhez M, Lindenskov Joensen L, Secombes CJ, Jørgensen JB. Skjesol A, et al. Dev Comp Immunol. 2014 Jul;45(1):177-89. doi: 10.1016/j.dci.2014.02.009. Epub 2014 Feb 28. Dev Comp Immunol. 2014. PMID: 24582990 - Viral infections in humans and mice with genetic deficiencies of the type I IFN response pathway.
Meyts I, Casanova JL. Meyts I, et al. Eur J Immunol. 2021 May;51(5):1039-1061. doi: 10.1002/eji.202048793. Epub 2021 Apr 4. Eur J Immunol. 2021. PMID: 33729549 Free PMC article. Review. - SOCS, Intrinsic Virulence Factors, and Treatment of COVID-19.
Johnson HM, Lewin AS, Ahmed CM. Johnson HM, et al. Front Immunol. 2020 Oct 23;11:582102. doi: 10.3389/fimmu.2020.582102. eCollection 2020. Front Immunol. 2020. PMID: 33193390 Free PMC article. Review.
Cited by
- Ubiquitination-mediated regulation of interferon responses.
Fuchs SY. Fuchs SY. Growth Factors. 2012 Jun;30(3):141-8. doi: 10.3109/08977194.2012.669382. Epub 2012 Mar 7. Growth Factors. 2012. PMID: 22394219 Free PMC article. Review. - Viruses exacerbating chronic pulmonary disease: the role of immune modulation.
Singanayagam A, Joshi PV, Mallia P, Johnston SL. Singanayagam A, et al. BMC Med. 2012 Mar 15;10:27. doi: 10.1186/1741-7015-10-27. BMC Med. 2012. PMID: 22420941 Free PMC article. Review. - 17β-Estradiol protects the esophageal epithelium from IL-13-induced barrier dysfunction and remodeling.
Wheeler JC, Vanoni S, Zeng C, Waggoner L, Yang Y, Wu D, Uddin J, Karns R, Kottyan L, Mukkada V, Rothenberg ME, Hogan SP. Wheeler JC, et al. J Allergy Clin Immunol. 2019 Jun;143(6):2131-2146. doi: 10.1016/j.jaci.2018.10.070. Epub 2018 Dec 20. J Allergy Clin Immunol. 2019. PMID: 30578870 Free PMC article. - SIAH2 antagonizes TYK2-STAT3 signaling in lung carcinoma cells.
Müller S, Chen Y, Ginter T, Schäfer C, Buchwald M, Schmitz LM, Klitzsch J, Schütz A, Haitel A, Schmid K, Moriggl R, Kenner L, Friedrich K, Haan C, Petersen I, Heinzel T, Krämer OH. Müller S, et al. Oncotarget. 2014 May 30;5(10):3184-96. doi: 10.18632/oncotarget.1899. Oncotarget. 2014. PMID: 24833526 Free PMC article. - Functional Genomics in Psoriasis.
Rossi S, Richards EL, Orozco G, Eyre S. Rossi S, et al. Int J Mol Sci. 2024 Jul 4;25(13):7349. doi: 10.3390/ijms25137349. Int J Mol Sci. 2024. PMID: 39000456 Free PMC article. Review.
References
- de Weerd N. A., Samarajiwa S. A., Hertzog P. J. (2007) J. Biol. Chem. 282, 20053–20057 - PubMed
- Platanias L. C., Fish E. N. (1999) Exp. Hematol. 27, 1583–1592 - PubMed
- Colamonici O. R., Uyttendaele H., Domanski P., Yan H., Krolewski J. J. (1994) J. Biol. Chem. 269, 3518–3522 - PubMed
- Domanski P., Fish E., Nadeau O. W., Witte M., Platanias L. C., Yan H., Krolewski J., Pitha P., Colamonici O. R. (1997) J. Biol. Chem. 272, 26388–26393 - PubMed
Publication types
MeSH terms
Substances
LinkOut - more resources
Full Text Sources
Other Literature Sources
