ChIP-seq reveals cell type-specific binding patterns of BMP-specific Smads and a novel binding motif - PubMed (original) (raw)
. 2011 Nov 1;39(20):8712-27.
doi: 10.1093/nar/gkr572. Epub 2011 Jul 15.
Affiliations
- PMID: 21764776
- PMCID: PMC3203580
- DOI: 10.1093/nar/gkr572
ChIP-seq reveals cell type-specific binding patterns of BMP-specific Smads and a novel binding motif
Masato Morikawa et al. Nucleic Acids Res. 2011.
Abstract
Dysregulated bone morphogenetic protein (BMP) signaling in endothelial cells (ECs) and pulmonary arterial smooth muscle cells (PASMCs) are implicated in human genetic disorders. Here, we generated genome-wide maps of Smad1/5 binding sites in ECs and PASMCs. Smad1/5 preferentially bound to the region outside the promoter of known genes, and the binding was associated with target gene upregulation. Cell-selective Smad1/5 binding patterns appear to be determined mostly by cell-specific differences in baseline chromatin accessibility patterns. We identified, for the first time, a Smad1/5 binding motif in mammals, and termed GC-rich Smad binding element (GC-SBE). Several sequences in the identified GC-SBE motif had relatively weak affinity for Smad binding, and were enriched in cell type-specific Smad1/5 binding regions. We also found that both GC-SBE and the canonical SBE affect binding affinity for the Smad complex. Furthermore, we characterized EC-specific Smad1/5 target genes and found that several Notch signaling pathway-related genes were induced by BMP in ECs. Among them, a Notch ligand, JAG1 was regulated directly by Smad1/5, transactivating Notch signaling in the neighboring cells. These results provide insights into the molecular mechanism of BMP signaling and the pathogenesis of vascular lesions of certain genetic disorders, including hereditary hemorrhagic telangiectasia.
Figures
Figure 1.
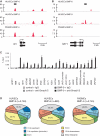
Genome-wide identification and characterization of Smad1/5 binding sites in HUVECs. (A and B) Genomic loci of ID1 (A) and HEY1 (B) are shown together with the results of ChIP-seq (in red). The direction of transcription is shown by the arrow beginning at the TSS. Horizontal black bars represent the positions of previously reported Smad1/5/8 binding regions. (C) HUVECs were stimulated with 1 ng/ml BMP-9 for 1.5 h and subjected to ChIP assays with anti-Smad1/5 antibody or control IgG. The ChIP samples were quantified by real-time PCR with locus specific primers and normalized to input DNA. The dashed line indicates 0.01% of input. The data are the mean of triplicate values ± SD. (D) Genome-wide location summary of Smad1/5 binding regions relative to known genes in human genome (hg18). Ten kilo base pairs upstream and downstream regions are defined as ≤10 kb upstream from the TSS or ≤10 kb downstream from the transcription end site (TES) of a gene, respectively. Distal intergenic refers to all locations outside the intragenic and the 10 kb flanking regions.
Figure 2.
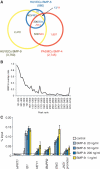
Comparison of Smad1/5 binding regions in HUVECs and PASMCs. (A) A Venn diagram represents the overlaps of Smad1/5 binding regions of HUVECs treated with BMP-9 (Yellow) or BMP-6 (Blue) and PASMCs treated with BMP-4 (Red). The number of binding regions of HUVECs treated with BMP-9 (Black) or BMP-6 (Blue) and that of PASMCs treated with BMP-4 (Red) are also shown. The numbers of overlapped regions are not identical, since some of the peaks are not on a one-by-one correspondence. (B) ChIP-seq peaks of HUVECs treated with BMP-9 are ranked by peak height. Fraction of peaks overlapped with the peaks of HUVECs treated with BMP-6 is calculated for every 100 peak and plotted. Overlapped peaks are enriched in the high ranked peaks. (C) HUVECs were starved overnight and stimulated with the indicated concentration of BMP-6 or BMP-9 for 1.5 h and were subjected to ChIP assays with anti-Smad1/5 antibody. The ChIP samples were quantified by real-time PCR with locus-specific primers and normalized to input DNA. The dashed line indicates 0.01% of input. The data are the mean of triplicate values ± SD.
Figure 3.
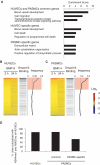
Genome-wide identification of cell type-specific BMP target genes and gene expression profiles. (A) GO enrichment analysis was performed to elucidate the biological processes and pathways associated with each gene cluster. The top three annotation clusters are shown in bar plots. The value reflects the Enrichment Score. Group names are based on interpretation of enriched GO annotations. (B and C) Gene expression profiles of HUVECs of HUVECs with BMP-9 stimulation or PASMCs with BMP-4 are illustrated by heat map. Probes are sorted by fold change relative to time 0 at early phase (2 h after stimulation) (left panel). Increased or decreased mRNA expression is represented by red or blue, respectively. Black horizontal bars represent probes of genes associated with Smad1/5 binding regions (middle panel). Moving average of the frequency of probes with Smad1/5 binding is plotted in a 1000-probe sliding window (right panel). The red-colored areas indicate the probes, whose Smad binding frequency is higher than the expected average. The dashed line indicates the expected average. (D) Frequency of the Smad1/5 binding regions co-localized with enhancer regions of HUVECs. The Smad1/5 binding regions in PASMCs are divided into two groups, those shared with HUVECs or PASMC-specific sites.
Figure 4.
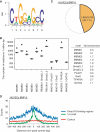
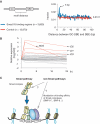
De novo prediction of Smad1/5 binding motif. Total 170 peak regions were analyzed for overrepresented motifs using MEME. (A) MEME2 is displayed as a sequence logo. (B) Enrichment of TFBS in the Smad1/5 binding regions. Fifty sets of non-overlapping matched genomic control sequences were used as background control. Data are given as boxplot. The circles represent outlier values. The black circles indicate the number of matched motifs observed in the Smad1/5 binding regions. (C) MEME2 motif occurs in about 45% of all Smad1/5 binding regions in HUVECs stimulated with BMP-9. (D) Distribution of MEME2 motif around the peak summits. The number of the MEME2 motif around the peak summits was counted and plotted in a 7 bp sliding window against the distance from the summits (within 500 bp from the summits) (blue). The motifs closest to the summits are located within 100 bp from the peak summit (First motif; green). Five separate matched control regions were randomly chosen by CisGenome and used as a control. The number of the MEME2 motif in those regions was counted and the average was plotted (red).
Figure 5.
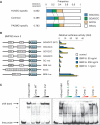
Validation of GGAGCC sequence as a novel BMP responsive element. (A) Frequency of GC-SBE sequences in the Smad1/5 binding regions. GGCGCC, GGAGCC and GCCG sequences were enriched in the Smad1/5 binding regions. The ratio of GGAGCC:GGCGCC is indicated. (B) pGL4-BMPR2 reporter constructs were introduced into HUVECs using lentiviral vector system, in order to evaluate their enhancer activity. The cells were stimulated with indicated doses of BMP-9 or BMP-6 and then they were harvested and assayed for luciferase activity at 12 h after stimulation. The data are the mean of triplicate values ± SD. (C) Recombinant human Smad1 MH1 proteins interacted with GGAGCC sequence. (Left panel) rhSmad1 MH1 binding to the probe was competed with a 50-fold molar excess of the unlabeled wild-type competitor (Comp. WT), but not with the mutant competitor (Comp. mut). (Right panel) To evaluate the importance of ‘A’ in GGAGCC sequence, single-point mutant competitors were evaluated. An asterisk indicates background band. Full wild-type probe sequence was ACAGCTCT GGAGCC AGATGGCCTGG.
Figure 6.
GC-SBE is required, but not sufficient, for full BMP responsiveness. (A) The distance between GC-SBE and GTCT-AGAC sequence in Smad1/5 binding regions is calculated and plotted (blue). Total 13 870 GC-SBEs in randomly-adapted control regions were used as a control (red). The dashed line indicates the expected average. (B) Graphical summary of expression microarray data of genes with GC-SBE and GTCT-AGAC composite motif with 5 bp spacer. The value of genes with GC-SBE/SBE composite motif with 5 bp spacer is represented as log2-fold change relative to time 0. Several, but not all of these genes were induced more than 2-fold within 2 h, including the well-known Smad1/5 target genes ID1, ID2, ID3 and NOG (Noggin) (red). (C) Schematic representation of Smad1/5 binding. Smad1/5 binding patterns appear to be predetermined by cell-specific differences in baseline chromatin accessibility patterns. Number and distribution of BR-Smad binding sites over the genome are primarily defined by the intensity of the Smad pathway. Each Smad1/5 binding site has different binding affinity for Smad complexes, which is determined by the affinities of GC-SBEs and SBEs. Non-Smad pathways were reported to affect the BR-Smad signaling through degrading Smad complexes or modulating binding affinity of Smad complexes. GC: GC-SBE, TFBS: transcription factor binding site.
Figure 7.
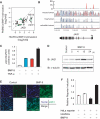
The Notch ligand JAG1 is a direct target gene of Smad1/5 and transactivates Notch signaling in the neighboring cells. (A) Scatter plot representation of differentially regulated genes between HUVECs and PASMCs. Probes of genes with more than 2-fold change in expression relative to time 0 are plotted. If the genes are associated with Smad1/5 binding regions of HUVECs (green), PASMCs (red) or both (black), the plots are colored. Signal intensities of HUVECs treated with BMP-9 for 2 h is plotted on the _X_-axis and those of PASMCs treated with BMP-4 for 2 h is plotted on the _Y_-axis. (B) Visualization of JAG1 locus with the result of BMP-9 ChIP-seq. Red peaks represent ChIP regions (top panel). The conservation plots for mouse/human, frog/human and zebrafish/human are derived from VISTA genome browser (middle panel), which represents the sequence conservation between species. (C) Induction of JAG1 after BMP-9 stimulation in HUVECs. HUVECs were starved overnight, stimulated with 1 ng/ml BMP-9 and/or 10 ng/ml TNF-α for 2 h and subjected to qRT–PCR analysis for JAG1. Values were normalized to the amount of housekeeping GAPDH mRNA. The data are the mean of triplicate values ± SD. (D) HUVECs were starved overnight and stimulated with 1 ng/ml BMP-9 for indicated time periods and subjected to immunoblot analysis to determine the JAG1 protein expression level. α-Tubulin was used as a loading control. (E) Immunocytochemistry of HUVECs treated with or without 1 ng/ml BMP-9 for 24 h. The cells were immunostained with anti-JAG1 antibody (green). Nuclei were labeled with TOTO-3 (blue). Scale bar, 100 µm. (F) Endothelial JAG1 induced by BMP-9 stimulation transactivates Notch signaling in neighboring cells. HeLa cells were transiently transfected with pGL4-12xCSL-luciferase reporter construct and co-cultured with HUVECs. Cells were treated with or without 5 ng/ml BMP-9 for 24 h and subjected to luciferase assay. The data are the mean of triplicate values ±SD.
Similar articles
- Mutations in bone morphogenetic protein type II receptor cause dysregulation of Id gene expression in pulmonary artery smooth muscle cells: implications for familial pulmonary arterial hypertension.
Yang J, Davies RJ, Southwood M, Long L, Yang X, Sobolewski A, Upton PD, Trembath RC, Morrell NW. Yang J, et al. Circ Res. 2008 May 23;102(10):1212-21. doi: 10.1161/CIRCRESAHA.108.173567. Epub 2008 Apr 24. Circ Res. 2008. PMID: 18436795 - Stalk cell phenotype depends on integration of Notch and Smad1/5 signaling cascades.
Moya IM, Umans L, Maas E, Pereira PN, Beets K, Francis A, Sents W, Robertson EJ, Mummery CL, Huylebroeck D, Zwijsen A. Moya IM, et al. Dev Cell. 2012 Mar 13;22(3):501-14. doi: 10.1016/j.devcel.2012.01.007. Epub 2012 Feb 23. Dev Cell. 2012. PMID: 22364862 Free PMC article. - Functional characterization of bone morphogenetic protein binding sites and Smad1/5 activation in human vascular cells.
Upton PD, Long L, Trembath RC, Morrell NW. Upton PD, et al. Mol Pharmacol. 2008 Feb;73(2):539-52. doi: 10.1124/mol.107.041673. Epub 2007 Nov 7. Mol Pharmacol. 2008. PMID: 17989347 - Vascular development: genetic mechanisms and links to vascular disease.
Chappell JC, Bautch VL. Chappell JC, et al. Curr Top Dev Biol. 2010;90:43-72. doi: 10.1016/S0070-2153(10)90002-1. Curr Top Dev Biol. 2010. PMID: 20691847 Review. - Bone morphogenetic proteins.
Chen D, Zhao M, Mundy GR. Chen D, et al. Growth Factors. 2004 Dec;22(4):233-41. doi: 10.1080/08977190412331279890. Growth Factors. 2004. PMID: 15621726 Review.
Cited by
- CLIMB: High-dimensional association detection in large scale genomic data.
Koch H, Keller CA, Xiang G, Giardine B, Zhang F, Wang Y, Hardison RC, Li Q. Koch H, et al. Nat Commun. 2022 Nov 12;13(1):6874. doi: 10.1038/s41467-022-34360-z. Nat Commun. 2022. PMID: 36371401 Free PMC article. - Context-dependent proangiogenic function of bone morphogenetic protein signaling is mediated by disabled homolog 2.
Kim JD, Kang H, Larrivée B, Lee MY, Mettlen M, Schmid SL, Roman BL, Qyang Y, Eichmann A, Jin SW. Kim JD, et al. Dev Cell. 2012 Aug 14;23(2):441-8. doi: 10.1016/j.devcel.2012.07.007. Dev Cell. 2012. PMID: 22898784 Free PMC article. - Chemical Conversion of Human Fetal Astrocytes into Neurons through Modulation of Multiple Signaling Pathways.
Yin JC, Zhang L, Ma NX, Wang Y, Lee G, Hou XY, Lei ZF, Zhang FY, Dong FP, Wu GY, Chen G. Yin JC, et al. Stem Cell Reports. 2019 Mar 5;12(3):488-501. doi: 10.1016/j.stemcr.2019.01.003. Epub 2019 Feb 7. Stem Cell Reports. 2019. PMID: 30745031 Free PMC article. - Decreased BMP2 signal in GIT1 knockout mice slows bone healing.
Sheu TJ, Zhou W, Fan J, Zhou H, Zuscik MJ, Xie C, Yin G, Berk BC. Sheu TJ, et al. Mol Cell Biochem. 2014 Dec;397(1-2):67-74. doi: 10.1007/s11010-014-2173-5. Epub 2014 Aug 20. Mol Cell Biochem. 2014. PMID: 25138700 Free PMC article. - Rare but specific: 5-bp composite motifs define SMAD binding in BMP signaling.
Jatzlau J, Do SN, Mees RA, Mendez PL, Khan RJ, Maas L, Ruiz L, Martin-Malpartida P, Macias MJ, Knaus P. Jatzlau J, et al. BMC Biol. 2025 Mar 13;23(1):79. doi: 10.1186/s12915-025-02183-1. BMC Biol. 2025. PMID: 40082964 Free PMC article.
References
- Miyazono K, Kamiya Y, Morikawa M. Bone morphogenetic protein receptors and signal transduction. J. Biochem. 2010;147:35–51. - PubMed
- Johnson DW, Berg JN, Baldwin MA, Gallione CJ, Marondel I, Yoon SJ, Stenzel TT, Speer M, Pericak-Vance MA, Diamond A, et al. Mutations in the activin receptor-like kinase 1 gene in hereditary haemorrhagic telangiectasia type 2. Nat. Genet. 1996;13:189–195. - PubMed
- McAllister KA, Grogg KM, Johnson DW, Gallione CJ, Baldwin MA, Jackson CE, Helmbold EA, Markel DS, McKinnon WC, Murrell J, et al. Endoglin, a TGF-beta binding protein of endothelial cells, is the gene for hereditary haemorrhagic telangiectasia type 1. Nat. Genet. 1994;8:345–351. - PubMed
Publication types
MeSH terms
Substances
LinkOut - more resources
Full Text Sources
Molecular Biology Databases
Miscellaneous
