The tumor suppressor Tsc1 enforces quiescence of naive T cells to promote immune homeostasis and function - PubMed (original) (raw)
The tumor suppressor Tsc1 enforces quiescence of naive T cells to promote immune homeostasis and function
Kai Yang et al. Nat Immunol. 2011.
Abstract
The mechanisms that regulate T cell quiescence are poorly understood. We report that the tumor suppressor Tsc1 established a quiescence program in naive T cells by controlling cell size, cell cycle entry and responses to stimulation of the T cell antigen receptor. Abrogation of quiescence predisposed Tsc1-deficient T cells to apoptosis that resulted in loss of conventional T cells and invariant natural killer T cells. Loss of Tsc1 function dampened in vivo immune responses to bacterial infection. Tsc1-deficient T cells had more activity of the serine-threonine kinase complex mTORC1 but less mTORC2 activity, and activation of mTORC1 was essential for the disruption of immune homeostasis. Therefore, Tsc1-dependent control of mTOR is crucial in actively maintaining the quiescence of naive T cells to facilitate adaptive immune function.
Figures
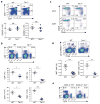
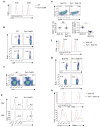
Figure 1. Tsc1 deficiency leads to disrupted homeostasis of peripheral T cell pools
(a) Flow cytometry of thymocytes in wild-type (WT) and _Tsc1_−/− mice. Lower panels, numbers of CD4SP and CD8SP thymocytes (n=4–7). (b) Flow cytometry of CD4 and CD8 T cells in the spleens of WT and _Tsc1_−/− mice. Lower panels, proportions and absolute numbers of CD4 and CD8 T cells in the spleens of WT and _Tsc1_−/− mice (n=4–6). (c) CD62L and CD44 expression on splenic T cells of WT and _Tsc1_−/− mice. (d) Flow cytometry of iNKT cells (TCRβ+CD1d-PBS57+) in the spleens of WT and _Tsc1_−/− mice (n≥5). (e) Flow cytometry of CD4 and CD8 T cells in the spleens of mixed BM chimeras. BM stem cells from wild-type (CD45.1+) and WT or _Tsc1_−/−mice (CD45.2+) were mixed at 1:1, and transferred into sublethally irradiated _Rag1_−/− mice to generate mixed BM chimeras, followed by analysis at 8 weeks after reconstitution. NS, not significant; * P < 0.005; ** P < 0.0005; *** P < 0.0001. Data are representative of 4 (a–d) and 2 (e) independent experiments.
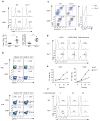
Figure 2. Tsc1 deletion results in markedly elevated apoptosis of T cells
(a) Caspase activity by FITC-VAD-FMK staining in freshly isolated WT and _Tsc1_−/− T cells. Lower panels, proportions of caspase-positive (Casp+) T cells (n=7–8). * P <0.005; ** P < 0.0005. (b) Flow cytometry of spleen (upper) and lymph node (lower) cells in the recipient mice (CD45.2+) 6 days after adoptive transfer of equal numbers of CD45.1+ (spike) cells and WT or _Tsc1_−/− donor cells (CFSE-labeled). SPL, spleen; PLN, peripheral lymph nodes. (c) Annexin V and 7-AAD staining in naive WT or _Tsc1_−/− T cells cultured with IL-7 in vitro for 3days (left), and expression of IL-7Rα on freshly isolated cells (right). (d) Detection of PI+ apoptotic cells after 16 hours of stimulation of CD8 T cells with anti-CD3, anti-CD3-CD28, or PMA-ionomycin. (e) Kinetics of apoptosis (measured by frequency of PI+ apoptotic cells) after anti-CD3-CD28 stimulation of CD4 and CD8 T cells. (f) Detection of PI+ apoptotic cells in WT and _Tsc1_−/− CD8 T cells pretreated with vehicle or caspase inhibitor Z-VAD-FAM for 1 hour and then activated with anti-CD3-CD28 for 10 hours. Although not shown here, similar results were observed in CD4 T cells (d,f). Data are representative of 4 (a,c), 2 (b,e), 5 (d) and 3 (f) independent experiments.
Figure 3. _Tsc1_-deficient T cells die via the Bcl-2 family-dependent intrinsic apoptotic pathway
(a) Intracellular Bcl-2 expression in WT and _Tsc1_−/− T cells. (b) Flow cytometry of CD4 and CD8 T cells in the spleens of WT, _Tsc1_−/−, _Bcl2-_TG, and _Tsc1_−/− _Bcl2-_TG mice. (c) Proportions and absolute numbers of CD4 and CD8 T cells in WT, Tsc1−/−, _Bcl2-_TG, and _Tsc1_−/−_Bcl2-_TG spleens (n=3–6). NS, not significant; * P <0.05; ** P < 0.005; *** P< 0.0001. (d,e) Detection of PI+ apoptotic cells after 16 hours of stimulation of CD4 (d) and CD8 (e) cells with anti-CD3-CD28. (f) Expression of BimEL and BimL in naive and anti-CD3-CD28 activated WT and _Tsc1_−/− CD4 T cells. Numbers above (BimEL) and below (BimL) lanes indicate band intensity relative to that of the loading control-actin. (g) ROS production in freshly isolated WT and _Tsc1_−/− T cells. Data are representative of 3 (a,d–g) and 4 (b,c) independent experiments.
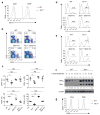
Figure 4. Tsc1 deficiency causes cell-autonomous loss of quiescence in vivo and hyperactive responses to TCR stimulation
(a) Cell size of freshly isolated WT and _Tsc1_−/− T cells. FSC, forward scattering. (b) BrdU staining in splenocytes of WT and _Tsc1_−/− mice 16 hours after injection with BrdU (n=3). (c) CD122 and CD44 expression on gated CD8 splenocytes of WT and _Tsc1_−/− mice. Right, ratios of CD122+/CD122− among CD44hi populations (n=5–8). (d) CD122 and CD44 expression on gated CD8 splenocytes in the mixed BM chimeras generated as in Fig. 1e. Right, ratios of CD122+/CD122− cells among CD44hi populations of the CD45.2+ cells (n=3). (e) Cell size of CD45.2+ cells in the mixed BM chimeras. (f) Flow cytometry of WT and _Tsc1_−/− naive T cells after stimulation with anti-CD3-CD28 for 16 hours for the measurements of cell size (upper) and ROS production (lower). (g) BrdU staining in naive T cells activated with anti-CD3-CD28 for 20 hours, followed by pulsing with BrdU for 90 min. (h) Expression of activation markers in WT and _Tsc1_−/− naive T cells after stimulation with anti-CD3-CD28 for 16 hours. * P <0.05; ** P < 0.01; *** P< 0.0001. Data are representative of 5 (a,c,f), 3 (b,d,e,g), and 4 (h) independent experiments.
Figure 5. Tsc1-dependent gene expression programs
(a) A subset of genes differentially regulated in WT and _Tsc1_−/− CD4 T cells activated with TCR for 4 hours (≥ 2-fold difference with false discovery rate <0.1). Triplicate samples were used in the analysis. (b) Real-time PCR analysis of selected genes in WT and _Tsc1_−/− CD4 T cells activated for various times. Data are representative of 2 independent experiments.
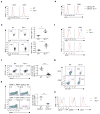
Figure 6. Loss of T cell quiescence results from inducible deletion of Tsc1 and is independent of cell survival
(a–d) Analyses of WT and _Tsc1_-CreER mice at 2 weeks after tamoxifen injection, for cell size of freshly isolated T cells (a), BrdU staining in splenocytes of mice 16 hours after injection with BrdU (b), splenic T cell populations (c), and PI+ apoptotic cells after 16 hours of anti-CD3-CD28 stimulation of naive T cells (d). (e–h) Analyses of WT and _Tsc1_−/− mice expressing the Bcl2 transgene, for expression of CD122 and CD44 on gated CD8 splenocytes (lower left, proportions of total CD44hi populations; lower right, ratios of CD122+/CD122− populations among CD44hi cells, n=4–6) (e), cell size of freshly isolated T cells (f), and BrdU staining in splenocytes of mice 16 hours after injection with BrdU (g). (h) Flow cytometry of naive T cells after stimulation with anti-CD3-CD28 for 16 hours for the measurements of cell size, ROS production, and expression of CD25 and CD69. NS, not significant; * P = 0.0001. Data are representative of 2 (a–d,h), 4 (e,f), and 3 (g) independent experiments.
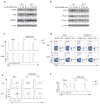
Figure 7. Tsc1 regulates mTORC1 and mTORC2 activities, with mTORC1 activation essential to disrupt immune quiescence and homeostasis
(a) Phosphorylation of S6K1, S6 and 4EBP1 in WT and _Tsc1_−/− naive CD4 T cells after they were stimulated with anti-CD3-CD28 for various times. (b) Phosphorylation of Akt (Ser473), Foxo1 and Foxo3 in WT and _Tsc1_−/−CD4 T cells after they were stimulated with anti-CD3-CD28 for various times. *, non-specific bands. Numbers below lanes (a,b) indicate band intensity relative to that of the loading control β-actin. (c) Cell size of freshly isolated splenocytes after WT and _Tsc1_−/− mice were treated with daily injection of rapamycin for a total of 3 or 5 days. (d) Flow cytometry of splenocytes in the recipient mice (CD45.2+) 6 days after adoptive transfer of equal numbers of CD45.1+ (spike) cells and WT or _Tsc1_−/− donor cells (CFSE-labeled) that were purified from mock or rapamycin-treated mice. Similar results were obtained in the recipient lymph nodes (not shown here). (e,f) Naive T cells from rapamycin or mock treated WT and _Tsc1_−/− mice were stimulated with anti-CD3-CD28 overnight, followed by measurements of PI+ apoptotic cells (e) and cell size (f). Data are representative of 5 (a,b) and 3 (c–f) independent experiments.
Figure 8. Tsc1 deficiency dampens antibacterial immune response in vivo
(a,b) Flow cytometry (a) and proportions and absolute numbers (b) of OVA-reactive tetramer-positive CD8 T cells in WT, _Tsc1_−/− and _Tsc1_−/− _Bcl2-_TG mice infected with LM-OVA. (c,d) Flow cytometry (c) and proportions and absolute numbers (d) of OVA-reactive IFN-γ+ CD8 T cells in LM-OVA infected mice, detected after OVA stimulation and intracellular cytokine staining. * P <0.005; ** P < 0.001; *** P< 0.0001. Data are representative of 3 independent experiments (n=8–10).
Comment in
- T cells: mTOR lullabies for naive T cells.
Papatriantafyllou M. Papatriantafyllou M. Nat Rev Immunol. 2011 Aug 5;11(9):572. doi: 10.1038/nri3047. Nat Rev Immunol. 2011. PMID: 21818125 No abstract available. - A 'Tsc, Tsc' keeps the kids quie(scen)t and holds down ROS.
Boothby M, Lee K. Boothby M, et al. Nat Immunol. 2011 Aug 18;12(9):811-2. doi: 10.1038/ni.2092. Nat Immunol. 2011. PMID: 21852776 No abstract available.
Similar articles
- Regulation of T-cell survival and mitochondrial homeostasis by TSC1.
O'Brien TF, Gorentla BK, Xie D, Srivatsan S, McLeod IX, He YW, Zhong XP. O'Brien TF, et al. Eur J Immunol. 2011 Nov;41(11):3361-70. doi: 10.1002/eji.201141411. Epub 2011 Sep 19. Eur J Immunol. 2011. PMID: 21805467 Free PMC article. - Critical role of the tumor suppressor tuberous sclerosis complex 1 in dendritic cell activation of CD4 T cells by promoting MHC class II expression via IRF4 and CIITA.
Pan H, O'Brien TF, Wright G, Yang J, Shin J, Wright KL, Zhong XP. Pan H, et al. J Immunol. 2013 Jul 15;191(2):699-707. doi: 10.4049/jimmunol.1201443. Epub 2013 Jun 17. J Immunol. 2013. PMID: 23776173 Free PMC article. - A 'Tsc, Tsc' keeps the kids quie(scen)t and holds down ROS.
Boothby M, Lee K. Boothby M, et al. Nat Immunol. 2011 Aug 18;12(9):811-2. doi: 10.1038/ni.2092. Nat Immunol. 2011. PMID: 21852776 No abstract available. - mTORC1 signaling and regulation of pancreatic β-cell mass.
Blandino-Rosano M, Chen AY, Scheys JO, Alejandro EU, Gould AP, Taranukha T, Elghazi L, Cras-Méneur C, Bernal-Mizrachi E. Blandino-Rosano M, et al. Cell Cycle. 2012 May 15;11(10):1892-902. doi: 10.4161/cc.20036. Epub 2012 May 15. Cell Cycle. 2012. PMID: 22544327 Free PMC article. Review. - The role and regulation of mTOR in T-lymphocyte function.
O'Brien TF, Zhong XP. O'Brien TF, et al. Arch Immunol Ther Exp (Warsz). 2012 Jun;60(3):173-81. doi: 10.1007/s00005-012-0171-4. Epub 2012 Apr 8. Arch Immunol Ther Exp (Warsz). 2012. PMID: 22484804 Free PMC article. Review.
Cited by
- PP2A catalytic subunit alpha is critically required for CD8+ T-cell homeostasis and antibacterial responses.
Zhou X, Li M, Ai M, Li Y, Zhu X, Hansen MJ, Zhong J, Johnson KL, Zenka R, Pandey A, Pease LR, Zeng H. Zhou X, et al. Eur J Immunol. 2024 Oct;54(10):e2451080. doi: 10.1002/eji.202451080. Epub 2024 Jul 28. Eur J Immunol. 2024. PMID: 39072720 - DEPDC5 protects CD8+ T cells from ferroptosis by limiting mTORC1-mediated purine catabolism.
Li S, Ouyang X, Sun H, Jin J, Chen Y, Li L, Wang Q, He Y, Wang J, Chen T, Zhong Q, Liang Y, Pierre P, Zou Q, Ye Y, Su B. Li S, et al. Cell Discov. 2024 May 20;10(1):53. doi: 10.1038/s41421-024-00682-z. Cell Discov. 2024. PMID: 38763950 Free PMC article. - Cellular metabolism regulates the differentiation and function of T-cell subsets.
Ma S, Ming Y, Wu J, Cui G. Ma S, et al. Cell Mol Immunol. 2024 May;21(5):419-435. doi: 10.1038/s41423-024-01148-8. Epub 2024 Apr 2. Cell Mol Immunol. 2024. PMID: 38565887 Free PMC article. Review. - Single-cell NAD(H) levels predict clonal lymphocyte expansion dynamics.
Turner L, Van Le TN, Cross E, Queriault C, Knight M, Trihemasava K, Davis J, Schaefer P, Nguyen J, Xu J, Goldspiel B, Hall E, Rome K, Scaglione M, Eggert J, Au-Yeung B, Wallace DC, Mesaros C, Baur JA, Bailis W. Turner L, et al. Sci Immunol. 2024 Mar 15;9(93):eadj7238. doi: 10.1126/sciimmunol.adj7238. Epub 2024 Mar 15. Sci Immunol. 2024. PMID: 38489349 Free PMC article. - Nutrients: Signal 4 in T cell immunity.
Raynor JL, Chi H. Raynor JL, et al. J Exp Med. 2024 Mar 4;221(3):e20221839. doi: 10.1084/jem.20221839. Epub 2024 Feb 27. J Exp Med. 2024. PMID: 38411744 Free PMC article.
References
- Surh CD, Sprent J. Homeostasis of naive and memory T cells. Immunity. 2008;29:848–862. - PubMed
- Takada K, Jameson SC. Naive T cell homeostasis: from awareness of space to a sense of place. Nat Rev Immunol. 2009;9:823–832. - PubMed
- Glynne R, Ghandour G, Rayner J, Mack DH, Goodnow CC. B-lymphocyte quiescence, tolerance and activation as viewed by global gene expression profiling on microarrays. Immunol Rev. 2000;176:216–246. - PubMed
Publication types
MeSH terms
Substances
Grants and funding
- R01 NS064599-02/NS/NINDS NIH HHS/United States
- K01 AR053573-02/AR/NIAMS NIH HHS/United States
- K01 AR053573-03/AR/NIAMS NIH HHS/United States
- R01 NS064599/NS/NINDS NIH HHS/United States
- P30 CA021765/CA/NCI NIH HHS/United States
- K01 AR053573-04/AR/NIAMS NIH HHS/United States
- K01 AR053573-01A1/AR/NIAMS NIH HHS/United States
- R01 NS064599-03/NS/NINDS NIH HHS/United States
- K01 AR053573/AR/NIAMS NIH HHS/United States
- R01 NS064599-01/NS/NINDS NIH HHS/United States
- K01 AR053573-03S1/AR/NIAMS NIH HHS/United States
LinkOut - more resources
Full Text Sources
Other Literature Sources
Molecular Biology Databases
Miscellaneous
