Defining the specificity of cotranslationally acting chaperones by systematic analysis of mRNAs associated with ribosome-nascent chain complexes - PubMed (original) (raw)
Defining the specificity of cotranslationally acting chaperones by systematic analysis of mRNAs associated with ribosome-nascent chain complexes
Marta del Alamo et al. PLoS Biol. 2011 Jul.
Abstract
Polypeptides exiting the ribosome must fold and assemble in the crowded environment of the cell. Chaperones and other protein homeostasis factors interact with newly translated polypeptides to facilitate their folding and correct localization. Despite the extensive efforts, little is known about the specificity of the chaperones and other factors that bind nascent polypeptides. To address this question we present an approach that systematically identifies cotranslational chaperone substrates through the mRNAs associated with ribosome-nascent chain-chaperone complexes. We here focused on two Saccharomyces cerevisiae chaperones: the Signal Recognition Particle (SRP), which acts cotranslationally to target proteins to the ER, and the Nascent chain Associated Complex (NAC), whose function has been elusive. Our results provide new insights into SRP selectivity and reveal that NAC is a general cotranslational chaperone. We found surprising differential substrate specificity for the three subunits of NAC, which appear to recognize distinct features within nascent chains. Our results also revealed a partial overlap between the sets of nascent polypeptides that interact with NAC and SRP, respectively, and showed that NAC modulates SRP specificity and fidelity in vivo. These findings give us new insight into the dynamic interplay of chaperones acting on nascent chains. The strategy we used should be generally applicable to mapping the specificity, interplay, and dynamics of the cotranslational protein homeostasis network.
Conflict of interest statement
The authors have declared that no competing interests exist.
Figures
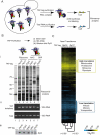
Figure 1. Global strategy to define specificity of ribosome-associated factors.
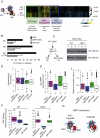
(A) Experimental approach. Nascent polypeptides emerging from the ribosome during biogenesis can interact with many chaperones and protein homeostasis factors. The high sensitivity of RNA identification can be used to identify substrates of specific cotranslationally acting chaperones. Protein A-tagged (TAP-tag) chaperones associated with translating ribosomes were immunopurified by binding to magnetic IgG beads, washed, and chaperone complexes were eluted with TEV protease treatment. Immunopurified RNAs and total cell extract RNAs were isolated, reverse transcribed, coupled to Cy5 and Cy3 dyes, respectively, and comparatively hybridized to DNA microarrays. (B) Validation of affinity purification approach of ribosomes and ribosome-associated factors. (i) Protein profiles of affinity purified complexes. Affinity purified complexes from tagged ribosomal proteins and ribosome-associated factors were separated by SDS-PAGE and visualized by silver staining. Lane 1 corresponds to a control purification from untagged yeast cells. Main band on the negative control corresponds to the TEV protease used to elute immunopurified proteins. (ii) RT-PCR for rRNA corresponding to the 18S ribosomal subunit. Equal amounts of total RNA isolated from yeast extracts and immunopurifications proteins were reverse-transcribed with random oligonucleotides and obtained cDNA was amplified by PCR using gene-specific primers for 18S rRNA. Strains used in each lane were: 1, untagged-WT; 2, Rpl16-TAP; 3, Rpl17-TAP; 4, Egd2-TAP; 5, Egd1-TAP; 6, Btt1-TAP; 7, Srp54-TAP. (iii) Immunoblot analysis of a component of 60S ribosomal subunit. Immunopurified complexes were transferred to nitrocellulose and the Rpl3 protein was detected with a monoclonal antibody. (C) Translational profile of yeast strains derived by affinity purification of ribosomes. Hierarchically clustered heat map of the translation profiles obtained from three different immunopurifications made of both TAP-tagged Rpl16 and Rpl17 ribosomal proteins. Each column represents an experiment and each row represents a gene. Pearson correlation coefficients between experiments are indicated on the tree. Significantly enriched GO terms (p<0.01) are indicated.
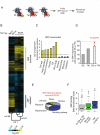
Figure 2. Identification and properties of polypeptides cotranslationally associated with SRP in yeast.
(A) Strategy to identify SRP interactors. SRP has been described to recognize signal sequences (SS) and transmembrane regions (TM) on nascent preproteins as they emerge from the ribosome. To identify the SRP cotranslational interactome, SRP-bound ribosome-nascent chain complexes (RNC) were affinity purified and identified associated-mRNA by means of microarrays. Importantly, our procedure releases SRP from the membrane, as no ER membrane markers copurify with the SRP-RNC complexes (unpublished). (B) Translational profile of SRP-bound RNC. Hierarchically clustered heat map of the translation profiles obtained from three different immunopurifications using TAP-tagged Srp54, Rpl16, and Rpl17. Each column represents a single experiment for Srp54-TAP and the average of three independent experiments for Rpl16 and Rpl17. Pearson correlation coefficients between experiments are indicated on the tree. Genes enriched or depleted in Srp54 immunopurifications are indicated. (C) Over-represented (yellow) and under-represented (cyan) GO annotations (component) for polypeptides cotranslationally associated with SRP. The extent of the enrichment for each GO term is indicated as fold enrichment over genome. GO terms above or below the dashed line correspond to ontology categories over-represented or under-represented among SRP interacting proteins. (D) Enrichment of mRNAs encoding proteins with predicted signal sequences (SS), transmembrane regions (TM), or both in association with SRP. (E) Distribution of subcellular localization of SRP targets without canonical SS/TM. (F) Relationship between SRP binding and N-terminal features in the nascent chains. The box plot represents the distribution of the enrichment (as SAM score) obtained on the microarrays analysis for mRNAs encoding proteins with predicted signal sequences, transmembrane regions, or lacking any of these two features. The line indicates the median and the whiskers of 25%–75% of the total dataset. For details, see Material and Methods, “Enrichment Distribution Analysis.”
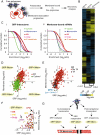
Figure 3. Global identification of membrane-associated mRNAs.
(A) Experimental Strategy: Isolation of membrane-associated polysomes. Membrane-associated polysomes were separated from free polysomes by subcellular fractionation of WT yeast strains and associated RNA was isolated and then identified by microarray analysis. (B) Translational profile of SRP-associated and membrane-associated ribosomes. Hierarchically clustered heat map of the translation profiles obtained from immunopurifications made for TAP-tagged Srp54 and Rpl16 and from membrane-associated RNA. Each column represents the average of three different experiments and each row represents a gene. Pearson correlation coefficients between patterns of enrichment in the different immunoaffinity isolations determine the relationships represented by the dendogram as indicated. (C) Distribution of (i) SRP- and (ii) membrane-associated mRNAs encoding proteins of the indicated subcellular compartments. The graph represents the enrichment observed for mRNAs encoding proteins localized to various subcellular compartments as cumulative fraction of total mRNAs; 70% of ER proteins are enriched in the membrane associated fraction and 60% are enriched in association with SRP. (D) Scatterplot comparing the enrichment, represented as its log2 ratio, of individual mRNAs encoding cytosolic and ER proteins in the membrane fraction and in association with SRP. The indicated log2 ratio values are the average of three independent experiments. (E) Scatterplot comparing the enrichment of individual mRNAs encoding ER proteins in the membrane fraction and in association with SRP. mRNAs encoding Tail-anchored proteins (TA) are highlighted in black. Mfa1, a post-translationally translocated protein, is represented in blue. (F) Scatterplot highlighting mRNAs encoding secretory pathway proteins that were not enriched in association with SRP but were enriched in the membrane fraction. These are putative substrates of SRP-independent pathways of cotranslational translocation. (G) Pathways to the ER membrane. SRP- or membrane-associated pools can be compared to describe different targeting pathways. Cotranslational pathways require mRNA transport to the ER membrane (Mem+). Targeting to the ER membrane can be SRP mediated (SRP+/Mem+) or SRP independent (SRP−/Mem+). Posttranslational translocation pathways do not require mRNA transport to the ER membrane or SRP association (SRP−/Mem−) and are likely mediated by the GET pathway or by cytoplasmic chaperones.
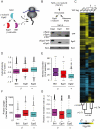
Figure 4. Global identification of polypeptides that interact cotranslationally with NAC.
(A) Global approach to identify polypeptides that associate cotranslationally with NAC by affinity purification of α (Egd2) and β (Egd1 and Btt1) NAC subunits. (B) Immunoblot analysis of affinity purified NAC complexes. Association of the indicated NAC subunit with ribosomes was detected using anti-Rpl3 monoclonal antibody; Egd2 (α) subunit using anti-Egd2 polyclonal antibody and TAP-tagged proteins were detected with anti-TAP polyclonal antibody. (C) Hierarchically clustered heat map of the mRNAs associated with ribosomes and RNCs bound to the indicated NAC subunits. Each column represents the average of three replicates and each row represents a gene. Pearson coefficient correlations between experimental sets are indicated on the dendogram. (D–G) Physicochemical properties of polypeptides that associate cotranslationally with NAC. Box plots showing the distribution of the hydrophobicity (D), predicted intrinsic disorder (E), protein length (F), and relative translation rate (G) of NAC polypeptides cotranslationally associated with individual NAC subunits.
Figure 5. Distinct functional and physical properties of the polypeptides cotranslationally associated with NAC.
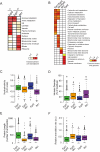
(A) Heat map indicating GO categories (rows) differentially represented in the sets of polypeptides cotranslationally associated with different NAC subunits. Enrichment of a specific GO annotation is evaluated in comparison to the representation of that annotation in the proteins encoded by mRNAs significantly enriched in association with Rpl16. (B) Enrichment of different GO ontology terms (rows) in target sets (1% FDR) of different NAC heterodimers. For this analysis, nascent polypeptides associated with each of two NAC subunits were considered to be targets of the corresponding heterodimer. The significance of the enrichment of the GO term is represented as fold enrichment over the genome on a heat map. (C–F) Physicochemical properties of NAC cotranslational interactors classified as substrates of the indicated hetero- or homodimers. Box plots showing the distribution of the hydrophobicity (C), intrinsic disorder (D), protein length (E), and relative translation rate (F) of NAC cotranslational interactors considering potential NAC dimers. For this analysis, targets common to Egd1 and Egd2 or to Egd2 and Btt1, respectively, were considered to represent targets of the corresponding heterodimers; targets unique to Egd2 or Btt1 were considered to represent targets of the corresponding homodimers.
Figure 6. NAC is a global modulator of SRP specificity in vivo.
(A) Hierarchically clustered heat map of the mRNAs cotranslationally associated with SRP in either the wild type (WT) or NAC-deleted (ΔNAC) cells. Boxes indicate genes significantly enriched (p<0.01) in association with SRP in both strains (purple) (NAC-Independent) or only in ΔNAC cells (green) (Off-target) or WT cells (blue) (NAC-Dependent). GO ontology categories significantly enriched (p<0.01) in each data set are indicated. Pearson coefficient correlations are indicated on the dendrogram. (B) Comparison of fraction of SRP substrates with predicted signal sequences (from Signal IP) or transmembrane regions (from TMHMM) in WT cells (black), ΔNAC cells (white), or the yeast genome (grey). (C) SRP association with ribosomes is unchanged by deletion of NAC. Total yeast lysates (T) were separated into ribosomal (P) and non-ribosomal fractions (S) through sedimentation on sucrose cushions at different salt concentrations (150 and 500 mM). SRP presence in the different fractions was determined by western blot using a polyclonal anti-TAP antibody. (D) Box plots representing the N-terminal hydrophobicity of different SRP cotranslational interactors: NAC-dependent, NAC-independent, and Off-target SRP interactors compared to the genome. (E) Distribution of mRNA expression level (i) and translation rate (ii) for different classes of SRP associated mRNAs. (F) Box plots representing the distribution of enrichment values (SAM score) for NAC-dependent, NAC-independent, and Off-target SRP interactors in WT and ΔNAC cells. (G) Schematic representation of SRP modulation by NAC. NAC favors SRP binding to cognate interactors (ER-destined proteins) and prevents binding to non-cognate interactors (cytosolic proteins).
Figure 7. Robustness of protein homeostasis and translocation compensates for NAC deletion.
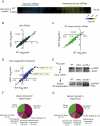
(A) Hierarchically clustered heat map of mRNAs in membrane-associated RNCs in WT and ΔNAC cells. (B) Scatterplot comparing the enrichment of individual membrane-associated mRNAs in wild type and ΔNAC strains. All points fall in a diagonal line, indicating that loss of NAC does not impair membrane targeting. (C) Scatterplot comparing the membrane enrichment for mRNAs encoding cytosolic Off-target SRP interactors in WT and ΔNAC strains. No increase is observed for the ΔNAC cells. (D) Scatterplot comparing the membrane enrichment for mRNAs encoding NAC-dependent SRP interactors in WT and ΔNAC strains for membrane-associated mRNAs. Values obtained for two known SRP targets, Kar2 and DPAP-B, are highlighted. (E) Translocation of Kar2 and DPAP-B is not affected by deletion of NAC. WT, ΔNAC, and Sec65-1 cells were pulse-labeled with 35S-methionine, immunoprecipitated with specific α-Kar2 and α-DPAP antibodies, and analyzed by SDS-PAGE and phosphorimaging. Positions of mature cleaved Kar2 (Kar2) and glycosylated DPAP (g-DPAP) and its precursors (uncleaved pre-Kar2 and DPAP) are indicated. (F–G) Transcriptional response to deletion of NAC. Pie charts show the distribution of genes upregulated in Δegd2/Δegd1 (F; 299 at 1% FDR) and Δegd2/Δbtt1 (G; 310 at 1% FDR).
Comment in
- SRP and NAC: guiding a nascent protein's first steps.
Sedwick C. Sedwick C. PLoS Biol. 2011 Jul;9(7):e1001103. doi: 10.1371/journal.pbio.1001103. Epub 2011 Jul 12. PLoS Biol. 2011. PMID: 21765805 Free PMC article. No abstract available.
Similar articles
- Cotranslational signal-independent SRP preloading during membrane targeting.
Chartron JW, Hunt KC, Frydman J. Chartron JW, et al. Nature. 2016 Aug 11;536(7615):224-8. doi: 10.1038/nature19309. Epub 2016 Aug 3. Nature. 2016. PMID: 27487213 Free PMC article. - The intrinsic ability of ribosomes to bind to endoplasmic reticulum membranes is regulated by signal recognition particle and nascent-polypeptide-associated complex.
Lauring B, Kreibich G, Weidmann M. Lauring B, et al. Proc Natl Acad Sci U S A. 1995 Oct 10;92(21):9435-9. doi: 10.1073/pnas.92.21.9435. Proc Natl Acad Sci U S A. 1995. PMID: 7568149 Free PMC article. - Regulation by a chaperone improves substrate selectivity during cotranslational protein targeting.
Ariosa A, Lee JH, Wang S, Saraogi I, Shan SO. Ariosa A, et al. Proc Natl Acad Sci U S A. 2015 Jun 23;112(25):E3169-78. doi: 10.1073/pnas.1422594112. Epub 2015 Jun 8. Proc Natl Acad Sci U S A. 2015. PMID: 26056263 Free PMC article. - Fidelity of Cotranslational Protein Targeting to the Endoplasmic Reticulum.
Hsieh HH, Shan SO. Hsieh HH, et al. Int J Mol Sci. 2021 Dec 28;23(1):281. doi: 10.3390/ijms23010281. Int J Mol Sci. 2021. PMID: 35008707 Free PMC article. Review. - [Multifunctional protein complex NAC (nascent polypeptide associated complex].
Kogan GL, Gvozdev VA. Kogan GL, et al. Mol Biol (Mosk). 2014 Mar-Apr;48(2):223-31. Mol Biol (Mosk). 2014. PMID: 25850291 Review. Russian.
Cited by
- Selective ribosome profiling as a tool for studying the interaction of chaperones and targeting factors with nascent polypeptide chains and ribosomes.
Becker AH, Oh E, Weissman JS, Kramer G, Bukau B. Becker AH, et al. Nat Protoc. 2013 Nov;8(11):2212-39. doi: 10.1038/nprot.2013.133. Epub 2013 Oct 17. Nat Protoc. 2013. PMID: 24136347 Free PMC article. - Co-translational localization of an LTR-retrotransposon RNA to the endoplasmic reticulum nucleates virus-like particle assembly sites.
Doh JH, Lutz S, Curcio MJ. Doh JH, et al. PLoS Genet. 2014 Mar 6;10(3):e1004219. doi: 10.1371/journal.pgen.1004219. eCollection 2014 Mar. PLoS Genet. 2014. PMID: 24603646 Free PMC article. - OM14 is a mitochondrial receptor for cytosolic ribosomes that supports co-translational import into mitochondria.
Lesnik C, Cohen Y, Atir-Lande A, Schuldiner M, Arava Y. Lesnik C, et al. Nat Commun. 2014 Dec 9;5:5711. doi: 10.1038/ncomms6711. Nat Commun. 2014. PMID: 25487825 Free PMC article. - Translational landscape and protein biogenesis demands of the early secretory pathway in Komagataella phaffii.
Alva TR, Riera M, Chartron JW. Alva TR, et al. Microb Cell Fact. 2021 Jan 20;20(1):19. doi: 10.1186/s12934-020-01489-9. Microb Cell Fact. 2021. PMID: 33472617 Free PMC article. - Resistance to paclitxel in breast carcinoma cells requires a quality control of mitochondrial antiapoptotic proteins by TRAP1.
Maddalena F, Sisinni L, Lettini G, Condelli V, Matassa DS, Piscazzi A, Amoroso MR, La Torre G, Esposito F, Landriscina M. Maddalena F, et al. Mol Oncol. 2013 Oct;7(5):895-906. doi: 10.1016/j.molonc.2013.04.009. Epub 2013 May 2. Mol Oncol. 2013. PMID: 23735188 Free PMC article.
References
- Albanese V, Yam A. Y, Baughman J, Parnot C, Frydman J. Systems analyses reveal two chaperone networks with distinct functions in eukaryotic cells. Cell. 2006;124:75–88. - PubMed
- Brown J. D, Ng D. T, Ogg S. C, Walter P. Targeting pathways to the endoplasmic reticulum membrane. Cold Spring Harb Symp Quant Biol. 1995;60:23–30. - PubMed
- Wegrzyn R. D, Hofmann D, Merz F, Nikolay R, Rauch T, et al. A conserved motif is prerequisite for the interaction of NAC with ribosomal protein L23 and nascent chains. J Biol Chem. 2006;281:2847–2857. - PubMed
- Jungnickel B, Rapoport T. a. A posttargeting signal sequence recognition event in the endoplasmic reticulum membrane. Cell. 1995;82:261–270. - PubMed
Publication types
MeSH terms
Substances
Grants and funding
- GM56433/GM/NIGMS NIH HHS/United States
- R01 CA077097/CA/NCI NIH HHS/United States
- HHMI/Howard Hughes Medical Institute/United States
- R01 GM056433/GM/NIGMS NIH HHS/United States
- CA77097/CA/NCI NIH HHS/United States
- R37 GM056433/GM/NIGMS NIH HHS/United States
LinkOut - more resources
Full Text Sources
Molecular Biology Databases
