A whole brain fMRI atlas generated via spatially constrained spectral clustering - PubMed (original) (raw)
. 2012 Aug;33(8):1914-28.
doi: 10.1002/hbm.21333. Epub 2011 Jul 18.
Affiliations
- PMID: 21769991
- PMCID: PMC3838923
- DOI: 10.1002/hbm.21333
A whole brain fMRI atlas generated via spatially constrained spectral clustering
R Cameron Craddock et al. Hum Brain Mapp. 2012 Aug.
Abstract
Connectivity analyses and computational modeling of human brain function from fMRI data frequently require the specification of regions of interests (ROIs). Several analyses have relied on atlases derived from anatomical or cyto-architectonic boundaries to specify these ROIs, yet the suitability of atlases for resting state functional connectivity (FC) studies has yet to be established. This article introduces a data-driven method for generating an ROI atlas by parcellating whole brain resting-state fMRI data into spatially coherent regions of homogeneous FC. Several clustering statistics are used to compare methodological trade-offs as well as determine an adequate number of clusters. Additionally, we evaluate the suitability of the parcellation atlas against four ROI atlases (Talairach and Tournoux, Harvard-Oxford, Eickoff-Zilles, and Automatic Anatomical Labeling) and a random parcellation approach. The evaluated anatomical atlases exhibit poor ROI homogeneity and do not accurately reproduce FC patterns present at the voxel scale. In general, the proposed functional and random parcellations perform equivalently for most of the metrics evaluated. ROI size and hence the number of ROIs in a parcellation had the greatest impact on their suitability for FC analysis. With 200 or fewer ROIs, the resulting parcellations consist of ROIs with anatomic homology, and thus offer increased interpretability. Parcellation results containing higher numbers of ROIs (600 or 1,000) most accurately represent FC patterns present at the voxel scale and are preferable when interpretability can be sacrificed for accuracy. The resulting atlases and clustering software have been made publicly available at: http://www.nitrc.org/projects/cluster\_roi/.
Copyright © 2011 Wiley Periodicals, Inc.
Figures
Figure 1
Comparison of r t and r s similarity metrics calculated from the resting state data of a single subject. Each point corresponds to a pair of voxels. Voxel pairs for which one metric is positive and the other is negative are shown in red. [Color figure can be viewed in the online issue, which is available at wileyonlinelibrary.com.]
Figure 2
Illustration of the method for creating connectivity matrices from a clustering solution. On the left is a two‐dimensional patch of 9 voxels that are clustered into two regions: white and gray. This is translated into a 9 × 9 connectivity matrix where a voxel from a cluster is connected to every other voxel from the same cluster with connection strength of 1, and unconnected to voxels that are not in the same cluster. The connectivity matrix entry for voxel 1 is highlighted on the right. It is connected to voxels 2, 3, 4, and 7, which are also in the white cluster.
Figure 3
Illustration of clustering results for the four combinations of functional parcellation methods and random parcellation containing 50, 200, or 1000 ROIs. Each parcellation is depicted as three orthogonal views. Color‐coding is arbitrarily used to best emphasize ROI boundaries. ROI coloring was matched across parcellation results to emphasize similarities in ROI locations between methods.
Figure 4
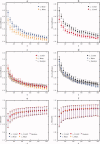
Comparison of parameter selection performance for each combination of parcellation strategy (r t group mean, r t two‐level, r s group mean, and r s two‐level) for K between 50 and 1,000, in multiples of 50. Panel (a) compares the LOOCV accuracy of r t group mean to r s group mean, (b) compares r t two‐level to r s two‐level, (c) compares r s group mean to r s two‐level, and (d) compares r t group mean to r t two‐level. The similarity between random parcellation and individual level functional parcellation results using r t and r s are included in panels (c) and (d) for comparison. Panel (e) compares the methods in terms of silhouette width calculated with the r t metric and (f) in terms of silhouette width calculated with the r s metric. Symbols are located at the median and error bars indicate 0.25 and 0.75 quartiles. Results from different parcellation strategies are overlapping and obscure one another. [Color figure can be viewed in the online issue, which is available at wileyonlinelibrary.com.]
Figure 5
Comparison of ROI homogeneity for r t 2‐level functional parcellation, anatomical atlas (A: AAL, E: Eickhoff‐Zilles, H: Harvard‐Oxford, T: Talairach and Tournoux), and random parcellation. The vertical axis corresponds to the average correlation between every pair of voxels (temporal in panel a, spatial in panel b) within an ROI, averaged across ROIs. Symbol is located at the subject median and error bars indicate inter‐quartile range. [Color figure can be viewed in the online issue, which is available at wileyonlinelibrary.com.]
Figure 6
Comparison of accuracy of representation for r t 2‐level functional parcellation, anatomical atlas (A: AAL, E: Eickhoff‐Zilles, H: Harvard‐Oxford, T: Talairach and Tournoux), and random parcellation. Symbol is located at the mean and error bars indicate standard deviation. Voxel‐wise FC maps for vPCC (ventral posterior cingulate cortex), M1 (left primary motor cortex), and V1 (primary visual cortex) were compared to ROI‐wise FC maps calculated from the same seeds using Pearson's correlation. ROI summary time courses were derived either by averaging (a–c) or using the first eigenvariate of a principle components analysis (PCA) (d–f).
Figure 7
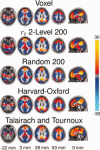
Comparison of voxel‐wise FC map of the default mode network to maps generated from a 200 ROI parcellation using r t 2‐level, random parcellation, the Harvard‐Oxford atlas and the Talairach and Tournoux atlas. FC maps were Fischer transformed, combined across subjects using a one‐sample t‐test and converted to z‐scores. No threshold was applied to the images.
Similar articles
- A human brain atlas derived via n-cut parcellation of resting-state and task-based fMRI data.
James GA, Hazaroglu O, Bush KA. James GA, et al. Magn Reson Imaging. 2016 Feb;34(2):209-18. doi: 10.1016/j.mri.2015.10.036. Epub 2015 Oct 31. Magn Reson Imaging. 2016. PMID: 26523655 Free PMC article. - AICHA: An atlas of intrinsic connectivity of homotopic areas.
Joliot M, Jobard G, Naveau M, Delcroix N, Petit L, Zago L, Crivello F, Mellet E, Mazoyer B, Tzourio-Mazoyer N. Joliot M, et al. J Neurosci Methods. 2015 Oct 30;254:46-59. doi: 10.1016/j.jneumeth.2015.07.013. Epub 2015 Jul 23. J Neurosci Methods. 2015. PMID: 26213217 - Brain parcellation driven by dynamic functional connectivity better capture intrinsic network dynamics.
Fan L, Zhong Q, Qin J, Li N, Su J, Zeng LL, Hu D, Shen H. Fan L, et al. Hum Brain Mapp. 2021 Apr 1;42(5):1416-1433. doi: 10.1002/hbm.25303. Epub 2020 Dec 7. Hum Brain Mapp. 2021. PMID: 33283954 Free PMC article. - The cerefy brain atlases: continuous enhancement of the electronic talairach-tournoux brain atlas.
Nowinski WL. Nowinski WL. Neuroinformatics. 2005;3(4):293-300. doi: 10.1385/NI:3:4:293. Neuroinformatics. 2005. PMID: 16284412 Review. - Human brain mapping: A systematic comparison of parcellation methods for the human cerebral cortex.
Arslan S, Ktena SI, Makropoulos A, Robinson EC, Rueckert D, Parisot S. Arslan S, et al. Neuroimage. 2018 Apr 15;170:5-30. doi: 10.1016/j.neuroimage.2017.04.014. Epub 2017 Apr 13. Neuroimage. 2018. PMID: 28412442 Review.
Cited by
- Improving practices and inferences in developmental cognitive neuroscience.
Flournoy JC, Vijayakumar N, Cheng TW, Cosme D, Flannery JE, Pfeifer JH. Flournoy JC, et al. Dev Cogn Neurosci. 2020 Oct;45:100807. doi: 10.1016/j.dcn.2020.100807. Epub 2020 Jun 30. Dev Cogn Neurosci. 2020. PMID: 32759026 Free PMC article. Review. - Probabilistic clustering of the human connectome identifies communities and hubs.
Hinne M, Ekman M, Janssen RJ, Heskes T, van Gerven MA. Hinne M, et al. PLoS One. 2015 Jan 30;10(1):e0117179. doi: 10.1371/journal.pone.0117179. eCollection 2015. PLoS One. 2015. PMID: 25635390 Free PMC article. - Accounting for Changing Structure in Functional Network Analysis of TBI Patients.
Dell'Italia J, Johnson MA, Vespa PM, Monti MM. Dell'Italia J, et al. Front Syst Neurosci. 2020 Aug 7;14:42. doi: 10.3389/fnsys.2020.00042. eCollection 2020. Front Syst Neurosci. 2020. PMID: 32848638 Free PMC article. - Spatial Dynamic Subspaces Encode Sex-Specific Schizophrenia Disruptions in Transient Network Overlap and Their Links to Genetic Risk.
Iraji A, Chen J, Lewis N, Faghiri A, Fu Z, Agcaoglu O, Kochunov P, Adhikari BM, Mathalon DH, Pearlson GD, Macciardi F, Preda A, van Erp TGM, Bustillo JR, Díaz-Caneja CM, Andrés-Camazón P, Dhamala M, Adali T, Calhoun VD. Iraji A, et al. Biol Psychiatry. 2024 Aug 1;96(3):188-197. doi: 10.1016/j.biopsych.2023.12.002. Epub 2023 Dec 7. Biol Psychiatry. 2024. PMID: 38070846 - Resting state cortico-cerebellar functional connectivity networks: a comparison of anatomical and self-organizing map approaches.
Bernard JA, Seidler RD, Hassevoort KM, Benson BL, Welsh RC, Wiggins JL, Jaeggi SM, Buschkuehl M, Monk CS, Jonides J, Peltier SJ. Bernard JA, et al. Front Neuroanat. 2012 Aug 10;6:31. doi: 10.3389/fnana.2012.00031. eCollection 2012. Front Neuroanat. 2012. PMID: 22907994 Free PMC article.
References
- Ashburner J, Friston KJ ( 2005): Unified segmentation. Neuroimage 26: 839–851. - PubMed
- Baumgartner R, Scarth G, Teichtmeister C, Somorjai R, Moser E ( 1997): Fuzzy clustering of gradient‐echo functional MRI in the human visual cortex. Part I: reproducibility. J Magn Reson Imaging 7: 1094–1101. - PubMed
- Bellec P, Perlbarg V, Jbabdi S, Pelegrini‐Issac M, Anton JL, Doyon J, Benali H ( 2006): Identification of large‐scale networks in the brain using fMRI. Neuroimage 29: 1231–1243. - PubMed
- Biswal BB, Mennes M, Zuo XN, Gohel S, Kelly C, Smith SM, Beckmann CF, Adelstein JS, Buckner RL, Colcombe S, Dogonowski AM, Ernst M, Fair D, Hampson M, Hoptman MJ, Hyde JS, Kiviniemi VJ, Kötter R, Li SJ, Lin CP, Lowe MJ, Mackay C, Madden DJ, Madsen KH, Margulies DS, Mayberg HS, McMahon K, Monk CS, Mostofsky SH, Nagel BJ, Pekar JJ, Peltier SJ, Petersen SE, Riedl V, Rombouts SA, Rypma B, Schlaggar BL, Schmidt S, Seidler RD, Siegle GJ, Sorg C, Teng GJ, Veijola J, Villringer A, Walter M, Wang L, Weng XC, Whitfield‐Gabrieli S, Williamson P, Windischberger C, Zang YF, Zhang HY, Castellanos FX, Milham MP ( 2010): Toward discovery science of human brain function. Proc Natl Acad Sci U S A 107: 4734–4739. - PMC - PubMed
Publication types
MeSH terms
Grants and funding
- K23 MH077869/MH/NIMH NIH HHS/United States
- P50 MH077083/MH/NIMH NIH HHS/United States
- R01 EB002009/EB/NIBIB NIH HHS/United States
- R01 MH073719/MH/NIMH NIH HHS/United States
LinkOut - more resources
Full Text Sources
Other Literature Sources


