CX3CR1 protein signaling modulates microglial activation and protects against plaque-independent cognitive deficits in a mouse model of Alzheimer disease - PubMed (original) (raw)
CX3CR1 protein signaling modulates microglial activation and protects against plaque-independent cognitive deficits in a mouse model of Alzheimer disease
Seo-Hyun Cho et al. J Biol Chem. 2011.
Abstract
Aberrant microglial activation has been proposed to contribute to the cognitive decline in Alzheimer disease (AD), but the underlying molecular mechanisms remain enigmatic. Fractalkine signaling, a pathway mediating the communication between microglia and neurons, is deficient in AD brains and down-regulated by amyloid-β. Although fractalkine receptor (CX3CR1) on microglia was found to regulate plaque load, no functional effects have been reported. Our study demonstrates that CX3CR1 deficiency worsens the AD-related neuronal and behavioral deficits. The effects were associated with cytokine production but not with plaque deposition. Ablation of CX3CR1 in mice overexpressing human amyloid precursor protein enhanced Tau pathology and exacerbated the depletion of calbindin in the dentate gyrus. The levels of calbindin in the dentate gyrus correlated negatively with those of tumor necrosis factor α and interleukin 6, suggesting neurotoxic effects of inflammatory factors. Functionally, removing CX3CR1 in human amyloid precursor protein mice worsened the memory retention in passive avoidance and novel object recognition tests, and their memory loss in the novel object recognition test is associated with high levels of interleukin 6. Our findings identify CX3CR1 as a key microglial pathway in protecting against AD-related cognitive deficits that are associated with aberrant microglial activation and elevated inflammatory cytokines.
Figures
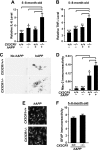
FIGURE 1.
Fractalkine signaling is down-regulated by Aβ in cultured microglia and in AD brains. A, representative images of CX3CR1 and CD68 immunostaining in rat primary mixed cortical cultures treated with or without 10 μ
m
oligomeric Aβ for 48 h. B and C, quantification of CX3CR1 mRNA in rat primary mixed cortical cultures (n = 6 from triplicate wells) (B) or microglia cultures (n = 3) (C), treated with designated concentrations of oligomeric Aβ1–42 or vehicle for 48 or 24 h, respectively. Because CX3CL1 is exclusively expressed in neurons, primary microglia cultures were pretreated with 3.3 n
m
CX3CL1 peptide for 16 h before being treated with Aβ1–42 for an additional 24 h. The levels of CX3CR1 were normalized with microglial marker (CD11b) in mixed cortical cultures (B) or with GAPDH in primary microglial cultures (C). D–G, deficiency in fractalkine signaling in AD brains. D and F, representative Western blots of CX3CR1 and CX3CL1 in the hippocampus (D) or frontal cortex (F) of AD patients and age-matched controls. E and G, quantification of CX3CR1 or CX3CL1 protein in the hippocampus (E) or frontal cortex (G) of AD (hippocampus, n = 24; frontal cortex, n = 5) patients and non-demented controls (hippocampus and frontal cortex, n = 4). ***, p < 0.001; **, p < 0.01; *, p < 0.05, unpaired Student's t test (C, E, and G). ***, p < 0.001; *, p < 0.05, one-way analysis of variance Tukey-Kramer post hoc analysis (B). Values are means ± S.E. (B, C, E, and G).
FIGURE 2.
Deletion of CX3CR1 does not affect Aβ levels or APP processing. A, representative Western blot of the metabolic fragments of hAPP. FL-hAPP, full-length hAPP. B, quantification of hAPP fragments (β-CTF and α-CTF) in the cortex of 5–8-month-old hAPP mice with or without CX3CR1. n = 6–11/genotype. C, ELISA measurements of soluble Aβ1-x or Aβ1–42 in the hippocampus of 2–4-month-old hAPP mice with or without CX3CR1. n = 5/genotype. D, representative picture of 3D6-immunoreactive plaques in the hippocampus of 6–7-month-old hAPP mice with or without CX3CR1. E, quantification of plaque load in the hippocampus of 6–7-month-old hAPP mice with or without CX3CR1. n = 8–11/genotype. F, representative Western blot of Aβ dimers and monomers in the hippocampus of 5–8-month-old hAPP/CX3CR1+/+ or _hAPP/CX3CR1_−/− mice. NTG, non-transgenic. G, quantification of levels of Aβ monomers or dimers in the hippocampus of 5–8-month-old hAPP/CX3CR1+/+ or _hAPP/CX3CR1_−/− mice. n = 6–7/genotype. Values are means ± S.E. (B, C, E, and G).
FIGURE 3.
Deletion of CX3CR1 exacerbates microglial activation. A and B, quantification of levels of IL-6 (A) or TNF-α (B) mRNA in the cortex of 5–8-month-old CX3CR1+/+, hAPP/CX3CR1+/+, _CX3CR1_−/−, or _hAPP/CX3CR1_−/− mice. n = 13–19 mice/genotype. C, representative picture of Mac-2 immunostaining in the hippocampus of 5–8-month-old wild type (CX3CR1+/+), hAPP/CX3CR1+/+, _CX3CR1_−/−, or _hAPP/CX3CR1_−/− mice. D, quantification of Mac-2 immunoreactive protein in the hippocampus. n = 8–9/genotype. E, representative images of GFAP immunostaining in the hippocampus of 5–8-month-old hAPP/CX3CR1+/+ or _hAPP/CX3CR1_−/− mice. F, quantification of immunoreactive GFAP in the hippocampus. n = 8–10/genotype. *, p < 0.05; **, p < 0.01; ***, p < 0.001, one-way analysis of variance Tukey-Kramer post hoc analysis (A, B, and D). Values are means ± S.E.
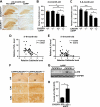
FIGURE 4.
Deletion of CX3CR1 exacerbates microglial toxicity in hAPP mice. A, representative images of calbindin immunostaining in the DG of 2–4-month-old CX3CR1+/+, hAPP/CX3CR1+/+, _CX3CR1_−/−, or _hAPP/CX3CR1_−/− mice. B and C, quantification of calbindin in the DG of 2–4-month-old (B) or 5–8-month-old (C) mice. n = 5–14/genotype *, p < 0.05; **, p < 0.01; ***, p < 0.001 (one-way analysis of variance with Newman-Keuls multiple comparison test). D and E, levels of calbindin in the DG correlated negatively with TNF-α or IL-6 in 5–8-month-old mice. n = 8–13 mice/genotype, Pearson's correlation. F, representative picture of phospho-Tau (AT-8) immunostaining in the hippocampus (HP) of 5–8-month-old hAPP mice with or without CX3CR1. G, representative Western blot of the phospho-Tau protein in the cortex of hAPP mice (hAPP/CX3CR1+/+ or _hAPP/CX3CR1_−/−). H, quantification of levels of phospho-Tau (p-Tau) (AT8; Ser-202/Thr-205) in the cortex of 5–8-month-old hAPP mice with or without CX3CR1. n = 5–6/genotype. *, p < 0.05, unpaired Student's t test. Values are means ± S.E. (B, C, and H).
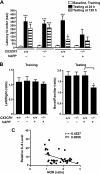
FIGURE 5.
CX3CR1 ablation exacerbates cognitive deficits in hAPP mice. A, in the passive avoidance task, the increased escape latency to enter the dark chamber during the test indicates memory retention. No difference was detected during the training (Baseline). During the test performed 24 or 120 h after the shock, latency was significantly increased in CX3CR1+/+, hAPP/CX3CR1+/+, and _CX3CR1_−/− mice, but not in _hAPP/CX3CR1_−/− mice. hAPP/CX3CR1+/+ mice exhibited reduced latency 120 h after the training. n = 8–10/genotype, 3–8 months old. *, p < 0.05; **, p < 0.01; ***, p < 0.001, paired Student's t test as compared with the correspondent training latency. Latency was recorded up to 500-s cutoff. B, in the novel object recognition task, the preference to the novel object, as measured by the ratios of the time spent on the novel versus familiar object during the test session, reflects memory retention. All genotypes exhibited no preference during the training session when left and right objects were the same. During the test session, _hAPP/CX3CR1_−/− mice exhibited less preference to the novel object than hAPP/CX3CR1+/+ mice. n = 8–10/genotype. *, p < 0.05, unpaired Student's t test. C, levels of IL-6 negatively correlated with the preference of the novel object recognition (NOR) test. n = 8–10 mice/genotype, Pearson's correlation. Values are means ± S.E. (A and B).
FIGURE 6.
Diagram depicts potential mechanisms by which fractalkine signaling limits microglial toxicity in AD. Down-regulation of CX3CR1 by Aβ treatment leads to increased expression of inflammatory factors, including IL-6 and TNF-α, and exacerbates cognitive decline in AD. Reduced expression of CX3CL1 by injured neurons could further activate microglia and feed into the vicious cycle. − indicates down-regulation; + indicates up-regulation.
Similar articles
- Effects of CX3CR1 and Fractalkine Chemokines in Amyloid Beta Clearance and p-Tau Accumulation in Alzheimer's Disease (AD) Rodent Models: Is Fractalkine a Systemic Biomarker for AD?
Merino JJ, Muñetón-Gómez V, Alvárez MI, Toledano-Díaz A. Merino JJ, et al. Curr Alzheimer Res. 2016;13(4):403-12. doi: 10.2174/1567205013666151116125714. Curr Alzheimer Res. 2016. PMID: 26567742 Review. - CX3CR1 deficiency alters microglial activation and reduces beta-amyloid deposition in two Alzheimer's disease mouse models.
Lee S, Varvel NH, Konerth ME, Xu G, Cardona AE, Ransohoff RM, Lamb BT. Lee S, et al. Am J Pathol. 2010 Nov;177(5):2549-62. doi: 10.2353/ajpath.2010.100265. Epub 2010 Sep 23. Am J Pathol. 2010. PMID: 20864679 Free PMC article. - Granulocyte colony stimulating factor decreases brain amyloid burden and reverses cognitive impairment in Alzheimer's mice.
Sanchez-Ramos J, Song S, Sava V, Catlow B, Lin X, Mori T, Cao C, Arendash GW. Sanchez-Ramos J, et al. Neuroscience. 2009 Sep 29;163(1):55-72. doi: 10.1016/j.neuroscience.2009.05.071. Epub 2009 Jun 14. Neuroscience. 2009. PMID: 19500657 Free PMC article. - Heterozygous CX3CR1 Deficiency in Microglia Restores Neuronal β-Amyloid Clearance Pathways and Slows Progression of Alzheimer's Like-Disease in PS1-APP Mice.
Hickman SE, Allison EK, Coleman U, Kingery-Gallagher ND, El Khoury J. Hickman SE, et al. Front Immunol. 2019 Dec 2;10:2780. doi: 10.3389/fimmu.2019.02780. eCollection 2019. Front Immunol. 2019. PMID: 31849963 Free PMC article. - Should We Open Fire on Microglia? Depletion Models as Tools to Elucidate Microglial Role in Health and Alzheimer's Disease.
Romero-Molina C, Navarro V, Jimenez S, Muñoz-Castro C, Sanchez-Mico MV, Gutierrez A, Vitorica J, Vizuete M. Romero-Molina C, et al. Int J Mol Sci. 2021 Sep 8;22(18):9734. doi: 10.3390/ijms22189734. Int J Mol Sci. 2021. PMID: 34575898 Free PMC article. Review.
Cited by
- Neural inflammation and the microglial response in diabetic retinopathy.
Abcouwer SF. Abcouwer SF. J Ocul Biol Dis Infor. 2012 Apr 24;4(1-2):25-33. doi: 10.1007/s12177-012-9086-x. Print 2011 Jun. J Ocul Biol Dis Infor. 2012. PMID: 23614055 Free PMC article. - Fractalkine Mediates Communication between Pathogenic Proteins and Microglia: Implications of Anti-Inflammatory Treatments in Different Stages of Neurodegenerative Diseases.
Desforges NM, Hebron ML, Algarzae NK, Lonskaya I, Moussa CE. Desforges NM, et al. Int J Alzheimers Dis. 2012;2012:345472. doi: 10.1155/2012/345472. Epub 2012 Aug 5. Int J Alzheimers Dis. 2012. PMID: 22919540 Free PMC article. - Increased Amyloid Precursor Protein and Tau Expression Manifests as Key Secondary Cell Death in Chronic Traumatic Brain Injury.
Acosta SA, Tajiri N, Sanberg PR, Kaneko Y, Borlongan CV. Acosta SA, et al. J Cell Physiol. 2017 Mar;232(3):665-677. doi: 10.1002/jcp.25629. Epub 2016 Oct 19. J Cell Physiol. 2017. PMID: 27699791 Free PMC article. - The ischemic environment drives microglia and macrophage function.
Fumagalli S, Perego C, Pischiutta F, Zanier ER, De Simoni MG. Fumagalli S, et al. Front Neurol. 2015 Apr 8;6:81. doi: 10.3389/fneur.2015.00081. eCollection 2015. Front Neurol. 2015. PMID: 25904895 Free PMC article. Review. - Immunohistochemical and Molecular Investigations Show Alteration in the Inflammatory Profile of Multiple System Atrophy Brain.
Kiely AP, Murray CE, Foti SC, Benson BC, Courtney R, Strand C, Lashley T, Holton JL. Kiely AP, et al. J Neuropathol Exp Neurol. 2018 Jul 1;77(7):598-607. doi: 10.1093/jnen/nly035. J Neuropathol Exp Neurol. 2018. PMID: 29850876 Free PMC article.
References
- Wyss-Coray T. (2006) Nat. Med. 12, 1005–1015 - PubMed
- McGeer P. L., Rogers J., McGeer E. G. (2006) J. Alzheimers Dis. 9, 271–276 - PubMed
- Seshadri S., Fitzpatrick A. L., Ikram M. A., DeStefano A. L., Gudnason V., Boada M., Bis J. C., Smith A. V., Carassquillo M. M., Lambert J. C., Harold D., Schrijvers E. M., Ramirez-Lorca R., Debette S., Longstreth W. T., Jr., Janssens A. C., Pankratz V. S., Dartigues J. F., Hollingworth P., Aspelund T., Hernandez I., Beiser A., Kuller L. H., Koudstaal P. J., Dickson D. W., Tzourio C., Abraham R., Antunez C., Du Y., Rotter J. I., Aulchenko Y. S., Harris T. B., Petersen R. C., Berr C., Owen M. J., Lopez-Arrieta J., Varadarajan B. N., Becker J. T., Rivadeneira F., Nalls M. A., Graff-Radford N. R., Campion D., Auerbach S., Rice K., Hofman A., Jonsson P. V., Schmidt H., Lathrop M., Mosley T. H., Au R., Psaty B. M., Uitterlinden A. G., Farrer L. A., Lumley T., Ruiz A., Williams J., Amouyel P., Younkin S. G., Wolf P. A., Launer L. J., Lopez O. L., van Duijn C. M., Breteler M. M. (2010) JAMA 303, 1832–1840 - PMC - PubMed
Publication types
MeSH terms
Substances
LinkOut - more resources
Full Text Sources
Other Literature Sources
Medical
Research Materials
Miscellaneous


