A pharmacogenomic method for individualized prediction of drug sensitivity - PubMed (original) (raw)
Meta-Analysis
A pharmacogenomic method for individualized prediction of drug sensitivity
Adam L Cohen et al. Mol Syst Biol. 2011.
Abstract
Identifying the best drug for each cancer patient requires an efficient individualized strategy. We present MATCH (Merging genomic and pharmacologic Analyses for Therapy CHoice), an approach using public genomic resources and drug testing of fresh tumor samples to link drugs to patients. Valproic acid (VPA) is highlighted as a proof-of-principle. In order to predict specific tumor types with high probability of drug sensitivity, we create drug response signatures using publically available gene expression data and assess sensitivity in a data set of >40 cancer types. Next, we evaluate drug sensitivity in matched tumor and normal tissue and exclude cancer types that are no more sensitive than normal tissue. From these analyses, breast tumors are predicted to be sensitive to VPA. A meta-analysis across breast cancer data sets shows that aggressive subtypes are most likely to be sensitive to VPA, but all subtypes have sensitive tumors. MATCH predictions correlate significantly with growth inhibition in cancer cell lines and three-dimensional cultures of fresh tumor samples. MATCH accurately predicts reduction in tumor growth rate following VPA treatment in patient tumor xenografts. MATCH uses genomic analysis with in vitro testing of patient tumors to select optimal drug regimens before clinical trial initiation.
Conflict of interest statement
The authors declare that they have no conflict of interest.
Figures
Figure 1
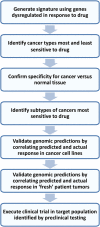
Flowchart of streamlined method to identify target population for a drug.
Figure 2
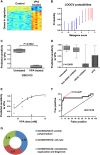
VPA signature. (A) The heatmap columns are the Connectivity Map samples with the 10 controls on the left and 5 treated samples on the right. Each row is a probe in the signature. Red indicates upregulation and blue indicates downregulation of the gene. (B) LOOCV from the Connectivity Map training sample. Blue samples (1–10) are the control samples. Red samples (11–15) are the VPA-treated samples. (C) Bar graph of mean and standard error of predicted VPA sensitivity on ovarian theca cells before and after treatment with VPA. (D) Graph of predicted sensitivity to VPA in Connectivity Map samples from nine independent batches. Samples are grouped as untreated controls, samples treated with a drug other than an HDAC inhibitor, samples treated with an HDAC inhibitor other than VPA, and samples treated with various doses of VPA. (E) Graph of sensitivity predictions versus actual treatment dose for Connectivity Map samples treated with various doses of VPA. The line is a best-fit sigmoidal curve excluding the two outliers. (F) ROC curve based on data from Figure 2D comparing VPA-treated samples with samples that were untreated or treated with a non-HDAC inhibitor. (G) Doughnut plot of the Gene Ontology terms for the genes in the VPA signature with Bayes factor >2. Bayes factor for each term is given on the doughnut.
Figure 3
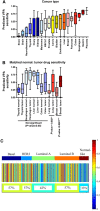
Predictions across cancer types and subtypes. (A) Box-whisker plot for predicted VPA sensitivity across GSK cell lines for epithelial cancers. Median is indicated by a horizontal line. The box gives the interquartile range, and the error bars indicate the total range. (B) Box-whisker plot for VPA sensitivity across cancer types in GSE5364. Boxes for normal adjacent tissue are checkered. Median is indicated by a horizontal line. The box gives the interquartile range, and the error bars indicate the total range. (C) Heatmap of samples from 11 breast cancer data sets, divided by intrinsic subtype, with the predicted response to VPA displayed as a color, with red representing a high predicted response, and blue a low predicted response. Each column is an individual sample, and the heterogeneity of predicted response to VPA within and between subtypes is clearly visible. The percent of samples with predicted sensitivity >0.5 is given below the heatmap.
Figure 4
PLX4032 signature and validation. (A) The heatmap columns are the GSE20051 samples with the five controls on the left and five treated samples on the right. Each row is a probe in the signature. Red indicates upregulation and blue indicates downregulation of the gene. (B) LOOCV from the GSE20051 training set. Blue samples (1–6) are the control samples. Red samples (7–12) are the PLX4032-treated samples. (C) Box-whisker plot for predicted PLX4032 sensitivity across GSK cell lines for epithelial cancers stratified by cancer type. (D) Box-whisker plot for PLX4032 sensitivity across skin cancer types and normal skin in GSE7553. (Cancer and normal types with two or fewer samples were excluded.) Median is indicated by a horizontal line.
Figure 5
Correlation of actual response to targeted therapeutics and predicted response from drug response signatures. Breast cancer cell lines were treated with VPA for 96 h and proliferation was assayed using a standard MTT colorimetric method. Scatter plot shows the degree of correlation between proliferation inhibition (EC50) and predicted sensitivity for each cell line. Source data is available for this figure at
.
Figure 6
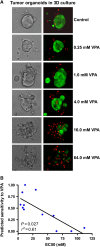
Patient tumor cell sensitivity to VPA in 3D culture. Primary tumor and pleural effusion-derived breast cancer cells were embedded in Matrigel and treated with VPA for 96 h. (A) The effect of VPA was assessed by light microscopy (right panel) and fluorescent dye (left panel) to identify live (green) and dead cells (red). (B) Correlation of EC50 of VPA and predicted response from drug response signatures in the fresh tumor samples grown in 3D. Source data is available for this figure at
.
Figure 7
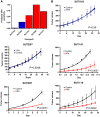
In vivo validation of computationally predicted responsiveness to VPA using human breast cancer xenografts. (A) Predicted sensitivity of five breast tumors (four basal and one luminal) to VPA. The gene expression patterns of the patient tumors were analyzed using in vitro drug response signatures to VPA. (B) In vivo response to VPA treatment on xenografts generated from the primary tumors in (A). Blue and red lines: VPA group; black line: saline control group. Each group had five mice. Tumor growth rates were plotted as the mean tumor volumes of each group±s.e.m. Source data is available for this figure at
.
Similar articles
- Development of candidate genomic markers to select breast cancer patients for dasatinib therapy.
Moulder S, Yan K, Huang F, Hess KR, Liedtke C, Lin F, Hatzis C, Hortobagyi GN, Symmans WF, Pusztai L. Moulder S, et al. Mol Cancer Ther. 2010 May;9(5):1120-7. doi: 10.1158/1535-7163.MCT-09-1117. Epub 2010 Apr 27. Mol Cancer Ther. 2010. PMID: 20423993 - An integration of complementary strategies for gene-expression analysis to reveal novel therapeutic opportunities for breast cancer.
Bild AH, Parker JS, Gustafson AM, Acharya CR, Hoadley KA, Anders C, Marcom PK, Carey LA, Potti A, Nevins JR, Perou CM. Bild AH, et al. Breast Cancer Res. 2009;11(4):R55. doi: 10.1186/bcr2344. Epub 2009 Jul 28. Breast Cancer Res. 2009. PMID: 19638211 Free PMC article. - A genomic approach to predict synergistic combinations for breast cancer treatment.
Soldi R, Cohen AL, Cheng L, Sun Y, Moos PJ, Bild AH. Soldi R, et al. Pharmacogenomics J. 2013 Feb;13(1):94-104. doi: 10.1038/tpj.2011.48. Epub 2011 Nov 15. Pharmacogenomics J. 2013. PMID: 22083351 Free PMC article. - Pharmacogenomics.
Ross JS, Schenkein DP, Kashala O, Linette GP, Stec J, Symmans WF, Pusztai L, Hortobagyi GN. Ross JS, et al. Adv Anat Pathol. 2004 Jul;11(4):211-20. doi: 10.1097/01.pap.0000131825.77317.ee. Adv Anat Pathol. 2004. PMID: 15220824 Review. - Current progress in the prediction of chemosensitivity for breast cancer.
Shimizu D, Ishikawa T, Ichikawa Y, Togo S, Hayasizaki Y, Okazaki Y, Shimada H. Shimizu D, et al. Breast Cancer. 2004;11(1):42-8. doi: 10.1007/BF02968001. Breast Cancer. 2004. PMID: 14718792 Review.
Cited by
- Window-of-Opportunity Study of Valproic Acid in Breast Cancer Testing a Gene Expression Biomarker.
Cohen AL, Neumayer L, Boucher K, Factor RE, Shrestha G, Wade M, Lamb JG, Arbogast K, Piccolo SR, Riegert J, Schabel M, Bild AH, Werner TL. Cohen AL, et al. JCO Precis Oncol. 2017 Apr 7;1:PO.16.00011. doi: 10.1200/PO.16.00011. eCollection 2017. JCO Precis Oncol. 2017. PMID: 32913974 Free PMC article. - Managing drug resistance in cancer: lessons from HIV therapy.
Bock C, Lengauer T. Bock C, et al. Nat Rev Cancer. 2012 Jun 7;12(7):494-501. doi: 10.1038/nrc3297. Nat Rev Cancer. 2012. PMID: 22673150 Review. - Sex-Biased Molecular Signature for Overall Survival of Liver Cancer Patients.
Kim SY, Song HK, Lee SK, Kim SG, Woo HG, Yang J, Noh HJ, Kim YS, Moon A. Kim SY, et al. Biomol Ther (Seoul). 2020 Nov 1;28(6):491-502. doi: 10.4062/biomolther.2020.157. Biomol Ther (Seoul). 2020. PMID: 33077700 Free PMC article. Review. - Molecular signatures from omics data: from chaos to consensus.
Sung J, Wang Y, Chandrasekaran S, Witten DM, Price ND. Sung J, et al. Biotechnol J. 2012 Aug;7(8):946-57. doi: 10.1002/biot.201100305. Epub 2012 Apr 23. Biotechnol J. 2012. PMID: 22528809 Free PMC article. Review. - Genomic medicine and lung diseases.
Center DM, Schwartz DA, Solway J, Gail D, Laposky AD, Lin QS, Gan W. Center DM, et al. Am J Respir Crit Care Med. 2012 Aug 1;186(3):280-5. doi: 10.1164/rccm.201203-0569WS. Epub 2012 May 31. Am J Respir Crit Care Med. 2012. PMID: 22652029 Free PMC article. Review.
References
- Adjei AA, Christian M, Ivy P (2009) Novel designs and end points for phase II clinical trials. Clin Cancer Res 15: 1866–1872 - PubMed
- Alexe G, Dalgin GS, Scanfeld D, Tamayo P, Mesirov JP, DeLisi C, Harris L, Barnard N, Martel M, Levine AJ, Ganesan S, Bhanot G (2007) High expression of lymphocyte-associated genes in node-negative HER2+ breast cancers correlates with lower recurrence rates. Cancer Res 67: 10669–10676 - PubMed
- Barron JJ, Cziraky MJ, Weisman T, Hicks DG (2009) HER2 testing and subsequent trastuzumab treatment for breast cancer in a managed care environment. Oncologist 14: 760–768 - PubMed
- Bast RC Jr, Hortobagyi GN (2004) Individualized care for patients with cancer—a work in progress. N Engl J Med 351: 2865–2867 - PubMed
- Bild AH, Yao G, Chang JT, Wang Q, Potti A, Chasse D, Joshi MB, Harpole D, Lancaster JM, Berchuck A, Olson JA Jr, Marks JR, Dressman HK, West M, Nevins JR (2006) Oncogenic pathway signatures in human cancers as a guide to targeted therapies. Nature 439: 353–357 - PubMed
Publication types
MeSH terms
Substances
Grants and funding
- R01 GM085601/GM/NIGMS NIH HHS/United States
- R01GM085601/GM/NIGMS NIH HHS/United States
- T32 CA093247/CA/NCI NIH HHS/United States
- R00 LM009837/LM/NLM NIH HHS/United States
- T32 CA93247/CA/NCI NIH HHS/United States
LinkOut - more resources
Full Text Sources
Medical
Molecular Biology Databases
