FGF-2 regulates cell proliferation, migration, and angiogenesis through an NDY1/KDM2B-miR-101-EZH2 pathway - PubMed (original) (raw)
FGF-2 regulates cell proliferation, migration, and angiogenesis through an NDY1/KDM2B-miR-101-EZH2 pathway
Filippos Kottakis et al. Mol Cell. 2011.
Abstract
The histone H3K27 methyltransferase EZH2 plays an important role in oncogenesis, by mechanisms that are incompletely understood. Here, we show that the JmjC domain histone H3 demethylase NDY1 synergizes with EZH2 to silence the EZH2 inhibitor miR-101. NDY1 and EZH2 repress miR-101 by binding its promoter in concert, via a process triggered by upregulation of NDY1. Whereas EZH2 binding depends on NDY1, the latter binds independently of EZH2. However, both are required to repress transcription. NDY1 and EZH2 acting in concert upregulate EZH2 and stabilize the repression of miR-101 and its outcome. NDY1 is induced by FGF-2 via CREB phosphorylation and activation, downstream of DYRK1A, and mediates the FGF-2 and EZH2 effects on cell proliferation, migration, and angiogenesis. The FGF-2-NDY1/EZH2-miR-101-EZH2 axis described here was found to be active in bladder cancer. These data delineate an oncogenic pathway that functionally links FGF-2 with EZH2 via NDY1 and miR-101.
Copyright © 2011 Elsevier Inc. All rights reserved.
Figures
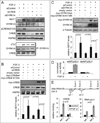
Figure 1. NDY1 downregulates miR-101 and upregulates EZH2
(A) (Left panel) Nuclear extracts of MEFs transduced with HA-NDY1 or pBabe (EV) were probed with the indicated antibodies. (Middle panel) EZH2 mRNA levels were measured by real time RT-PCR. (Right panel) miR-101 levels were measured by real time RT-PCR. The data are presented as mean ± SD. (B) MEFs transduced with the loxp.myc-NDY1.loxp MigR1 construct were super-infected with MigR1-Cre or the empty vector. Subsequently, they were transfected with anti-miR-101 or anti-miR-control. (Top panel) Nuclear lysates harvested from these cells were probed with the indicated antibodies. (Bottom panel) miR-101 levels were measured in the same loxP.myc-NDY1._loxP_-transduced MEFs by real time RT-PCR. The data are presented as mean ± SD. (C) (Upper panel) Nuclear lysates of MEFs transduced with wild type or mutant NDY1 were probed with the indicated antibodies. (Middle panel) MiR-101 levels were measured in the cells shown in the upper panel, by real time RT-PCR. (Lower panel) The same cells were transfected with a miR-101 promoter-luciferase reporter construct (Fig S1E) and the relative luciferase activities in the transfected cells were measured as in Fig S1B. The data are presented as mean ± SD.
Figure 2. Overexpressed NDY1 recruits basally expressed EZH2, which binds in concert with NDY1 to the miR-101 locus
(A) NDY1 silences miR-101 by binding the locus in concert with EZH2 and BMI1. (Upper panel) miR-101 (box) and flanking sequences. Set 1 through Set 4 are the primer sets used for ChIP. The numbers above the line show the position of the primers relative to the transcriptional start site. (Lower panels) MEFs were transduced with EV or pBabe-HA-NDY1 and they were used for ChIP with the indicated antibodies. The bars show the fold change in binding (mean ± SD) in the NDY1/KBM2B relative to the vector-transduced cells. (B) In the absence of EZH2, NDY1 binds to the promoter of miR-101 but it does not silence its expression. MEFs were transduced with a MigR1 construct of NDY1 or with the EV and they were superinfected with lentiviral shEZH2 or with shControl. (Left panel) MiR-101 levels measured by real time RT-PCR. Data shown as mean ± SD. (Right panel) The same cells were used for ChIP with the indicated antibodies. The bars show the fold change in NDY1 binding or H3K36me2 abundance (mean ± SD) relative to the EV-shControl-transduced cells. (C) EZH2 overexpression does not silence the expression of miR-101. MEFs were transduced with a pBabe construct of EZH2 or with the EV. (Left and middle panel) NDY1 mRNA and miR-101 levels were measured by real time RT-PCR. Data are expressed as mean ± SD. (Right panel) The same cells were used for ChIP with the indicated antibodies. The bars show the binding (mean ± SD) in EZH2 relative to vector-transduced cells. (D) The demethylase activity of NDY1 is essential for the recruitment of EZH2 to the miR-101 locus and the silencing of miR-101. MEFs were transduced with pBabe/HA-NDY1wt, pBabe/HA-NDY1 H283Y or with the empty vector. Transduced cells were used for ChIP with the indicated antibodies. The bars show the fold change in HA-NDY1/EZH2 binding and H3K36me2 abundance (mean ± SD) in NDY1wt or NDY1H283Y relative to the vector-transduced cells.
Figure 3. FGF-2 induces NDY1, which upregulates EZH2 by repressing miR-101
(A) Serum starved MEFs were stimulated with growth factors and they were harvested 12 hours later. (Top three panels) NDY1, EZH2 and miR-101 were measured in these lysates by real time RT-PCR. Data expressed as mean ± SD. (Lower panel) Nuclear lysates were probed with anti-EZH2 or anti-CREB. (B) (Upper panel) Nuclear extracts of siControl-transfected MEFs were harvested after stimulation with FGF-2 and they were probed with the indicated antibodies. (Middle panel) NDY1 and EZH2 mRNAs were measured with real time RT-PCR. (Lower panel) miR-101 levels were measured with real time RT-PCR. Data in the middle and lower panels are expressed as mean ± SD. (C) The same experiments as in the B were done using MEFs transduced with siNDY1. (D) FGF-2-induced NDY1 upregulation promotes the recruitment of EZH2, which binds the miR-101 locus, in concert with NDY1. MEFs were transfected with siNDY1 or siControl. Serum starved cells were stimulated with FGF-2 and they were used for ChIP. Bars show the fold change in the binding of EZH2 and RNA Pol II, or in the abundance of selected histone modifications in FGF-2-stimulated, relative to unstimulated-control cells (mean ± SD).
Figure 4. FGF-2 upregulates NDY1 via a DYRK1/CREB-dependent process
(A) DYRK1A-dependent phosphorylation of CREB at Serine-133 in FGF-2-treated cells promotes the upregulation of NDY1. MEFs transfected with siDYRK1A, siCREB or siControl were serum-starved for 12 hours and then stimulated with FGF-2. (Upper panel) Cell lysates were probed with the indicated antibodies. (Lower panel) DYRK1A immunoprecipitates of the siControl or siCREB transfected cells were probed with the indicated antibodies. (B) The knockdown of CREB interferes with the induction of NDY1 by FGF-2. Phenotypic rescue with CREBwt but not with CREB S133A. MEFs transduced with wild type CREB (myc-CREBwt), the phosphorylation-deficient CREB mutant (myc-CREB S133A) or the empty vector were transfected with siControl or siCREB and then stimulated with FGF-2. (Top panel) Nuclear extracts of these cells were probed with the indicated antibodies (Bottom panel) NDY1 mRNA levels were measured by real time RT-PCR. Data are expressed as mean ± SD. (C) The knockdown of DYRK1A interferes with the induction of NDY1 by FGF-2. Phenotypic rescue with DYRK1Awt but not with DYRK1A S133A. MEFs transduced with wild type DYRK1A (myc-DYRK1Awt), the kinase-dead DYRK1A mutant (myc-DYRK1A K179R) or the empty vector were transfected with siControl or siDYRK1A and then stimulated with FGF-2. (Top panel) Nuclear extracts of these cells were probed with the indicated antibodies (Bottom panel) NDY1 mRNA levels were measured by real time RT-PCR. Data are expressed as mean ± SD. (D) Ndy1 promoter activity in serum starved, FGF-2-stimulated MEFs depends on CREB. MEFs were transfected with a pGL3-based construct of a 1.1 kb wild type ndy1 promoter (wtNP/pGL3) or with an identical construct with an internal 13 bp deletion of the CREB binding site (delNP/pGL3). Data are expressed as mean ± SD. (E) CREB binds the ndy1 promoter, in parallel with RNA Pol II. (Top) Schematic of the ndy1 promoter, showing the CREB binding site and the placement of the two sets of ChIP primers. (Bottom) ChIP assays showing the relative binding of CREB and RNA Pol II in MEFs, before and after stimulation with FGF-2. Data are expressed as mean ± SD.
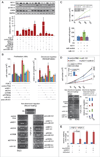
Figure 5. FGF-2-induced cell proliferation and migration in MEFs, and in vitro tube formation in HUVECs, depend on the NDY1-miR-101-EZH2 pathway
(A) The induction of EZH2 in FGF-2-stimulated cells depends on the induction of NDY1 by its upstream regulators in the FGF-2 pathway and on the repression of its target, miR-101. MEFs transfected with the indicated siRNAs, miR-101 and anti-miR-101, were serum-starved for 12 hours, and then stimulated with FGF-2. (Top panel) Nuclear cell lysates were probed with the indicated antibodies. (Bottom panel) miR-101 levels were measured by real time RT-PCR 48 hours after FGF-2 stimulation. Data are expressed as mean ± SD. (B) Cell proliferation and directional and non-directional migration of FGF-2-stimulated cells depend on the activation of the NDY1-miR-101-EZH2 pathway. (Left panel) MEFs transfected with siControl were cultured in serum-free media with or without FGF-2. Parallel cultures of MEFs transfected with the indicated siRNAs, miR-101, or anti-miR-101 were grown in the presence of FGF-2. Cell numbers were measured at the indicated time point and the data are expressed as mean ± SD. (Middle panel) Directional migration toward FGF-2 was measured in the same cells as in A. Relative migration is the ratio of siRNA ± miR-101 or anti-miR-101-transfected cells migrating toward FGF-2 over the siControl-transfected cells migrating toward FGF-2-free media ×100. Data are expressed as mean ± SD. (Right panel) Wound healing assays were carried out on a monolayer of confluent cultures of the MEFs used in the experiment in A. The images show the wounded areas 12 hours after wounding. (C) The repression of miR-101 is required for the stimulation of cell proliferation and migration by NDY1. (Left panel) MEFs transduced with pBabe-HA-NDY1, or empty vector were transfected with miR-control or mir-101. Cell numbers were measured at the indicated time points after FGF-2 stimulation. Data are expressed as mean ± SD. (Right panel) Directional migration, of the cells in the left panel. Relative migration was calculated as in B, right panel. (D) The knockdown of NDY1 and the overexpression of miR-101 inhibit FGF-2-induced cell proliferation and migration in wild type MEFs but not in MEFs engineered to express EZH2. (Left panel) MEFs transduced with pbabe-myc-EZH2 or EV were transfected with siControl, siNDY1, miR-101 or siNDY1 ± mir-101. Cell numbers were measured at the indicated time points after FGF-2 stimulation and the Data are expressed as mean ± SD. (Middle panel) Wound healing assays were carried out on a monolayer of confluent cultures of the MEFs in the experiment in A. The images show the wounded areas at 24 hours after wounding. (Right panel) Directional migration toward FGF-2 was measured in the same cells as in the middle panel. Relative migration was calculated as in B and C (mean ± SD). (E) HUVECs transduced with pBabe-myc-EZH2 or EV were transduced with pLKO.1-shNDY1 or pLKO.1-shControl and stimulated with FGF-2. Tube formation assay was performed on Cultrex-RGF-BME (Reduced Growth Factor Basement Membrane Extract) in the presence or absence of FGF-2 (20ng/ml). Quantitation of the in vitro tube formation was performed with the Angioquant software. Relative tube formation is the ratio of total capillary tube length in experimental cultures over the total capillary tube length in EV cells cultured in the absence of FGF-2. Data are expressed as mean ± SD. For more information, see also figure S5.
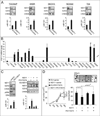
Figure 6. The activity of the NDY1-miR-101-EZH2 pathway in cancer cell lines depends on FGF-2
(A) Twenty five human tumor cell lines cells were transfected with siNDY1 or siControl. The knockdown of NDY1 in five of the transfected lines (TCCSUP, WIDR, SKOV3, NCI522 or T24) upregulated miR-101 and downregulated EZH2. (Upper panel) Nuclear lysates were probed with the indicated antibodies. (Lower panel) miR-101 levels were measured in the same cells, using real time RT-PCR. Data are expressed as mean ± SD. (B) FGF-2 mRNA levels were measured with real time RT-PCR. Data are expressed as mean ± SD. (C) WIDR cells transduced or not transduced with pBabe-HA-NDY1 were treated with PD173074 or carrier for 24 hours. (Upper panels) Nuclear and cytoplasmic cell lysates were probed with indicated antibodies. (Lower panels) miR-101 levels were measured in the same cells, using real time RT-PCR. Data are expressed as mean ± SD. (D) The inhibition of WIDR cell accumulation over time in attached and soft agar cultures treated with PD173074 is rescued by wild type NDY1. (Left panel) WIDR cells transduced with pBabe/HA-NDY1 or the empty vector (EV) were cultured in the presence of the PD173074 or carrier (DMSO). Cell numbers were monitored at the indicated time points and the data are expressed as mean ± SD. (Right panel) 2×10⁴ WIDR cells transduced with pBabe/HA-NDY1 or the empty vector were cultured in soft agar in the presence or absence of PD173074. Colony numbers per plate (mean ± SD) were counted at 10 days. The statistical significance of the data in both panels was assessed with the two-sample t-test.
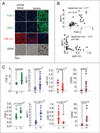
Figure 7. NDY1-miR-101-EZH2 pathway is active in primary tumors
(A) Immunofluorescence/Immunohistochemistry (FGF-2 and EZH2) and in-situ hybridization (NDY1 and miR-101) in transitional cell bladder carcinomas. Representative images out of a 48-core (40 carcinomas/8 normal tissue samples) bladder tissue array. (B) (Upper panel) The expression of NDY1 exhibits a linear correlation with the expression of FGF-2. Correlation coefficient: 0.77 and significance p=1.3×10⁻⁷ by Spearman correlation analysis. (Lower panel) The expression of NDY1 and miR-101 in bladder carcinomas exhibit a non-linear inverse correlation. Correlation coefficient: −0.47 and significance: P=0.002 by Spearman correlation analysis. (C) (Upper panel) Comparison of the expression levels of FGF-2, NDY1, miR-101 and EZH2 in the normal bladder tissue samples and the bladder carcinomas in the bladder carcinoma tissue array. Expression was measured as described in the Experimental Procedures. Statistical significance was calculated using the unpaired Student’s t test. (Lower panel) Comparison of the expression levels of FGF-2, miR-101 and EZH2 in bladder carcinomas expressing high and low levels of NDY1. Expression was measured as described in the Experimental Procedures. Statistical significance was calculated using the unpaired Student’s t test.
Similar articles
- The downregulation of GFI1 by the EZH2-NDY1/KDM2B-JARID2 axis and by human cytomegalovirus (HCMV) associated factors allows the activation of the HCMV major IE promoter and the transition to productive infection.
Sourvinos G, Morou A, Sanidas I, Codruta I, Ezell SA, Doxaki C, Kampranis SC, Kottakis F, Tsichlis PN. Sourvinos G, et al. PLoS Pathog. 2014 May 15;10(5):e1004136. doi: 10.1371/journal.ppat.1004136. eCollection 2014 May. PLoS Pathog. 2014. PMID: 24830456 Free PMC article. - Lysine-specific demethylase 2B (KDM2B)-let-7-enhancer of zester homolog 2 (EZH2) pathway regulates cell cycle progression and senescence in primary cells.
Tzatsos A, Paskaleva P, Lymperi S, Contino G, Stoykova S, Chen Z, Wong KK, Bardeesy N. Tzatsos A, et al. J Biol Chem. 2011 Sep 23;286(38):33061-9. doi: 10.1074/jbc.M111.257667. Epub 2011 Jul 11. J Biol Chem. 2011. PMID: 21757686 Free PMC article. - NDY1/KDM2B functions as a master regulator of polycomb complexes and controls self-renewal of breast cancer stem cells.
Kottakis F, Foltopoulou P, Sanidas I, Keller P, Wronski A, Dake BT, Ezell SA, Shen Z, Naber SP, Hinds PW, McNiel E, Kuperwasser C, Tsichlis PN. Kottakis F, et al. Cancer Res. 2014 Jul 15;74(14):3935-46. doi: 10.1158/0008-5472.CAN-13-2733. Epub 2014 May 22. Cancer Res. 2014. PMID: 24853546 Free PMC article. - Current perspectives on histone demethylases.
Tian X, Fang J. Tian X, et al. Acta Biochim Biophys Sin (Shanghai). 2007 Feb;39(2):81-8. doi: 10.1111/j.1745-7270.2007.00272.x. Acta Biochim Biophys Sin (Shanghai). 2007. PMID: 17277881 Review. - An EZ mark to miss.
Ho L, Crabtree GR. Ho L, et al. Cell Stem Cell. 2008 Dec 4;3(6):577-8. doi: 10.1016/j.stem.2008.11.007. Cell Stem Cell. 2008. PMID: 19041770 Free PMC article. Review.
Cited by
- The Heterochromatin Landscape in Migrating Cells and the Importance of H3K27me3 for Associated Transcriptome Alterations.
Segal T, Salmon-Divon M, Gerlitz G. Segal T, et al. Cells. 2018 Nov 9;7(11):205. doi: 10.3390/cells7110205. Cells. 2018. PMID: 30423977 Free PMC article. - Exploiting the fibroblast growth factor receptor-1 vulnerability to therapeutically restrict the MYC-EZH2-CDKN1C axis-driven proliferation in Mantle cell lymphoma.
Sircar A, Singh S, Xu-Monette ZY, Coyle KM, Hilton LK, Chavdoula E, Ranganathan P, Jain N, Hanel W, Tsichlis P, Alinari L, Peterson BR, Tao J, Muthusamy N, Baiocchi R, Epperla N, Young KH, Morin R, Sehgal L. Sircar A, et al. Leukemia. 2023 Oct;37(10):2094-2106. doi: 10.1038/s41375-023-02006-8. Epub 2023 Aug 19. Leukemia. 2023. PMID: 37598282 Free PMC article. - KDM2B overexpression correlates with poor prognosis and regulates glioma cell growth.
Wang Y, Zang J, Zhang D, Sun Z, Qiu B, Wang X. Wang Y, et al. Onco Targets Ther. 2018 Jan 8;11:201-209. doi: 10.2147/OTT.S149833. eCollection 2018. Onco Targets Ther. 2018. PMID: 29386904 Free PMC article. - GALNT14 promotes lung-specific breast cancer metastasis by modulating self-renewal and interaction with the lung microenvironment.
Song KH, Park MS, Nandu TS, Gadad S, Kim SC, Kim MY. Song KH, et al. Nat Commun. 2016 Dec 16;7:13796. doi: 10.1038/ncomms13796. Nat Commun. 2016. PMID: 27982029 Free PMC article. - The roles of ncRNAs and histone-modifiers in regulating breast cancer stem cells.
Zhao Z, Li S, Song E, Liu S. Zhao Z, et al. Protein Cell. 2016 Feb;7(2):89-99. doi: 10.1007/s13238-015-0199-4. Epub 2015 Sep 8. Protein Cell. 2016. PMID: 26349457 Free PMC article. Review.
References
- Cao R, Wang L, Wang H, Xia L, Erdjument-Bromage H, Tempst P, Jones RS, Zhang Y. Role of histone H3 lysine 27 methylation in Polycomb-group silencing. Science. 2002;298:1039–1043. - PubMed
- Cao Y, Cao R, Hedlund EM. R Regulation of tumor angiogenesis and metastasis by FGF and PDGF signaling pathways. J Mol Med. 2008;86:785–789. - PubMed
Publication types
MeSH terms
Substances
LinkOut - more resources
Full Text Sources


