Environmental and biofilm-dependent changes in a Bacillus cereus secondary cell wall polysaccharide - PubMed (original) (raw)
Environmental and biofilm-dependent changes in a Bacillus cereus secondary cell wall polysaccharide
Thomas Candela et al. J Biol Chem. 2011.
Abstract
Bacterial species from the Bacillus genus, including Bacillus cereus and Bacillus anthracis, synthesize secondary cell wall polymers (SCWP) covalently associated to the peptidoglycan through a phospho-diester linkage. Although such components were observed in a wide panel of B. cereus and B. anthracis strains, the effect of culture conditions or of bacterial growth state on their synthesis has never been addressed. Herein we show that B. cereus ATCC 14579 can synthesize not only one, as previously reported, but two structurally unrelated secondary cell wall polymers (SCWP) polysaccharides. The first of these SCWP, →4)[GlcNAc(β1-3)]GlcNAc(β1-6)[Glc(β1-3)][ManNAc(α1-4)]GalNAc(α1-4)ManNAc(β1→, although presenting an original sequence, fits to the already described the canonical sequence motif of SCWP. In contrast, the second polysaccharide was made up by a totally original sequence, →6)Gal(α1-2)(2-R-hydroxyglutar-5-ylamido)Fuc2NAc4N(α1-6)GlcNAc(β1→, which no equivalent has ever been identified in the Bacillus genus. In addition, we established that the syntheses of these two polysaccharides were differently regulated. The first one is constantly expressed at the surface of the bacteria, whereas the expression of the second is tightly regulated by culture conditions and growth states, planktonic, or biofilm.
Figures
FIGURE 1.
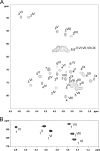
Structural mapping of HF-PS isolated from planktonic and biofilm phases of B. cereus ATCC 14579. 1H NMR spectra of HF-PS from planktonic (A) and biofilm (B) phases at four different growth times are shown. Spectra from all planktonic time points were identical, whereas spectra from early (28 and 48 h) differed from late biofilms (72 and 96 h). Three easily identified signals at 4.91, 2.52, and 1.13 ppm that show variations along growth times are highlighted in gray.
FIGURE 2.
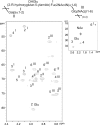
13C,1H HSQC NMR spectra of HF-PS from planktonic and biofilm phases of B. cereus ATCC 14579. Shown are the anomer regions (A–C) and nitrogen-bearing carbon regions (E–F) of 13C,1H HSQC spectra of intact HF-PS from planktonic phase (A and D), Ne HS-PS and Ch HF-PS fractions generated by mild hydrolysis from planktonic phase (B and E), and 24-h biofilm phase (C and F). In B and E, blue signals correspond to Ne HS-PS, and red signals to Ch HF-PS from planktonic phase.
FIGURE 3.
Purification schemes of HF-PS components. Two distinct components were separated using two different procedures. A, Ch HF-PS and Ne HF-PS were purified from total HF-PS by either mild acid hydrolysis or anion exchange chromatography. B, anion exchange chromatography separated a charged retained fraction (Ch HF-PS) from a neutral non-retained fraction (Ne HF-PS). C, mild acid hydrolysis followed by ethanol precipitation generated an acid labile fraction from an acid stable fraction, which subsequent structural analysis identified as Ch HF-PS and Ne HF-PS, respectively. The efficiency of acid hydrolysis was monitored along the hydrolysis steps (C). All purified fractions, as well as total HF-PS and intact B. cereus cells were analyzed by different combinations of analytical methods. *, contaminant non-carbohydrate signal.
FIGURE 4.
13C,1H HSQC NMR analysis of Ne HF-PS from planktonic phase. Shown is 13C,1H HSQC NMR spectra of the bulk region (A) and anomer region (B) of Ne HF-PS.
FIGURE 5.
Determination of the size distribution of Ne HF-PS from planktonic phase by MALDI-TOF-MS analysis. MS analysis in positive mode permitted identification of polymers with [M+Na]+ apparent molecular weights ranging from m/z 1218 to 8288. *, correspond to [M+Na-18]+ oxonium type fragments generated by in source fragmentations of the polysaccharide core.
FIGURE 6.
13C,1H HSQC NMR analysis of the Ch HF-PS from planktonic phase.
FIGURE 7.
Detail of the anomer region of 13C,1H HSQC HR-MAS NMR analysis of bacterial cell surface of B. cereus from planktonic phase of growth. When looked at a low sensitivity, only signals from Ch HF-PS (I to III) can be seen (A), whereas increasing sensitivity permits to recover signals from Ne HF-PS (IV to IX) (B).
FIGURE 8.
Structure of HF-PS repetition units isolated from B. cereus strains ATCC and 14579. Two unrelated polysaccharides, Ne HF-PS and Ch HF-PS, were identified from B. cereus 14579. Ne HF-PS is synthesized irrespective of the growing conditions, whereas Ch HF-PS synthesis is regulated along the biofilm formation and according to culture medium, HCT (poor medium) or BHI (rich medium). a, and d, planktonic phase; b, early biofilm formation (28–48 h); c, late biofilm formation (72–96 h).
FIGURE 9.
Comparison of the HF-PS isolated from bacteria grown in different media. 1H-NMR spectra of HF-PS isolated from the planktonic phases of bacteria grown in rich medium (BHI) (A) and poor medium (HCT) (B).
Similar articles
- The biosynthesis of UDP-d-FucNAc-4N-(2)-oxoglutarate (UDP-Yelosamine) in Bacillus cereus ATCC 14579: Pat and Pyl, an aminotransferase and an ATP-dependent Grasp protein that ligates 2-oxoglutarate to UDP-4-amino-sugars.
Hwang S, Li Z, Bar-Peled Y, Aronov A, Ericson J, Bar-Peled M. Hwang S, et al. J Biol Chem. 2014 Dec 19;289(51):35620-32. doi: 10.1074/jbc.M114.614917. Epub 2014 Nov 3. J Biol Chem. 2014. PMID: 25368324 Free PMC article. - Contribution of TagA-Like Glycosyltransferases to the Assembly of the Secondary Cell Wall Polysaccharide in Bacillus anthracis.
Tomatsidou A, Krunic M, Missiakas D. Tomatsidou A, et al. J Bacteriol. 2022 Sep 20;204(9):e0025322. doi: 10.1128/jb.00253-22. Epub 2022 Aug 23. J Bacteriol. 2022. PMID: 35997505 Free PMC article. - Assembly and Function of the Bacillus anthracis S-Layer.
Missiakas D, Schneewind O. Missiakas D, et al. Annu Rev Microbiol. 2017 Sep 8;71:79-98. doi: 10.1146/annurev-micro-090816-093512. Annu Rev Microbiol. 2017. PMID: 28622090 Free PMC article. Review. - Biology and taxonomy of Bacillus cereus, Bacillus anthracis, and Bacillus thuringiensis.
Vilas-Bôas GT, Peruca AP, Arantes OM. Vilas-Bôas GT, et al. Can J Microbiol. 2007 Jun;53(6):673-87. doi: 10.1139/W07-029. Can J Microbiol. 2007. PMID: 17668027 Review.
Cited by
- (1)H NMR-based metabolite profiling of planktonic and biofilm cells in Acinetobacter baumannii 1656-2.
Yeom J, Shin JH, Yang JY, Kim J, Hwang GS. Yeom J, et al. PLoS One. 2013;8(3):e57730. doi: 10.1371/journal.pone.0057730. Epub 2013 Mar 6. PLoS One. 2013. PMID: 23483923 Free PMC article. - Exposure of mycobacteria to cell wall-inhibitory drugs decreases production of arabinoglycerolipid related to Mycolyl-arabinogalactan-peptidoglycan metabolism.
Rombouts Y, Brust B, Ojha AK, Maes E, Coddeville B, Elass-Rochard E, Kremer L, Guerardel Y. Rombouts Y, et al. J Biol Chem. 2012 Mar 30;287(14):11060-9. doi: 10.1074/jbc.M111.327387. Epub 2012 Feb 7. J Biol Chem. 2012. PMID: 22315220 Free PMC article. - Chemical Synthesis of Rare, Deoxy-Amino Sugars Containing Bacterial Glycoconjugates as Potential Vaccine Candidates.
Behera A, Kulkarni SS. Behera A, et al. Molecules. 2018 Aug 10;23(8):1997. doi: 10.3390/molecules23081997. Molecules. 2018. PMID: 30103434 Free PMC article. Review. - The secondary cell wall polysaccharide of Bacillus anthracis provides the specific binding ligand for the C-terminal cell wall-binding domain of two phage endolysins, PlyL and PlyG.
Ganguly J, Low LY, Kamal N, Saile E, Forsberg LS, Gutierrez-Sanchez G, Hoffmaster AR, Liddington R, Quinn CP, Carlson RW, Kannenberg EL. Ganguly J, et al. Glycobiology. 2013 Jul;23(7):820-32. doi: 10.1093/glycob/cwt019. Epub 2013 Mar 14. Glycobiology. 2013. PMID: 23493680 Free PMC article. - Reduction of Spermidine Content Resulting from Inactivation of Two Arginine Decarboxylases Increases Biofilm Formation in Synechocystis sp. Strain PCC 6803.
Kera K, Nagayama T, Nanatani K, Saeki-Yamoto C, Tominaga A, Souma S, Miura N, Takeda K, Kayamori S, Ando E, Higashi K, Igarashi K, Uozumi N. Kera K, et al. J Bacteriol. 2018 Apr 9;200(9):e00664-17. doi: 10.1128/JB.00664-17. Print 2018 May 1. J Bacteriol. 2018. PMID: 29440257 Free PMC article.
References
- Vollmer W. (2008) FEMS Microbiol. Rev 32, 287–306 - PubMed
- Weidenmaier C., Peschel A., Xiong Y. Q., Kristian S. A., Dietz K., Yeaman M. R., Bayer A. S. (2005) J. Infect. Dis. 191, 1771–1777 - PubMed
- Chitlaru T., Ariel N., Zvi A., Lion M., Velan B., Shafferman A., Elhanany E. (2004) Proteomics 4, 677–691 - PubMed
- Gohar M., Gilois N., Graveline R., Garreau C., Sanchis V., Lereclus D. (2005) Proteomics 5, 3696–3711 - PubMed
Publication types
MeSH terms
Substances
LinkOut - more resources
Full Text Sources


