Foxp3+ follicular regulatory T cells control the germinal center response - PubMed (original) (raw)
. 2011 Jul 24;17(8):975-82.
doi: 10.1038/nm.2425.
Wim Pierson, Sau K Lee, Axel Kallies, Shimpei Kawamoto, Tim F Rayner, Monika Srivastava, Devina P Divekar, Laura Beaton, Jennifer J Hogan, Sidonia Fagarasan, Adrian Liston, Kenneth G C Smith, Carola G Vinuesa
Affiliations
- PMID: 21785433
- PMCID: PMC3182542
- DOI: 10.1038/nm.2425
Foxp3+ follicular regulatory T cells control the germinal center response
Michelle A Linterman et al. Nat Med. 2011.
Abstract
Follicular helper (T(FH)) cells provide crucial signals to germinal center B cells undergoing somatic hypermutation and selection that results in affinity maturation. Tight control of T(FH) numbers maintains self tolerance. We describe a population of Foxp3(+)Blimp-1(+)CD4(+) T cells constituting 10-25% of the CXCR5(high)PD-1(high)CD4(+) T cells found in the germinal center after immunization with protein antigens. These follicular regulatory T (T(FR)) cells share phenotypic characteristics with T(FH) and conventional Foxp3(+) regulatory T (T(reg)) cells yet are distinct from both. Similar to T(FH) cells, T(FR) cell development depends on Bcl-6, SLAM-associated protein (SAP), CD28 and B cells; however, T(FR) cells originate from thymic-derived Foxp3(+) precursors, not naive or T(FH) cells. T(FR) cells are suppressive in vitro and limit T(FH) cell and germinal center B cell numbers in vivo. In the absence of T(FR) cells, an outgrowth of non-antigen-specific B cells in germinal centers leads to fewer antigen-specific cells. Thus, the T(FH) differentiation pathway is co-opted by T(reg) cells to control the germinal center response.
Figures
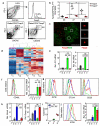
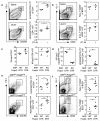
Figure 1. A proportion of CXCR5highPD-1highCD4+ cells express the transcription factor Foxp3
(a,b) After SRBC immunization Foxp3+ cells were identified in the CXCR5highPD-1highCD4+ ‘TFH’ compartment, these cells follow the same kinetics as classic TFH cells. (c) Foxp3+ cells (red) are present within the Bcl6+ germinal center area (green) following SRBC immunization. Scale bar represents 100μm. (d) Heat map comparing the gene expression profiles of different CD4+ T cell subsets from Foxp3GFP mice seven days after immunization. Red: high gene expression; blue: low gene expression. The cells were sorted using the following markers and for simplicity will be referred by the abbreviations in parentheses throughout: CD4+CD44lowFoxp3− naïve (TN) cells, CD4+CD44highCXCR5int/lowPD-1int/lowFoxp3− effector/memory (TEM) cells, CD4+CD44intCXCR5int/lowPD-1int/lowFoxp3+ regulatory T cells (Treg), CD4+CXCR5highPD-1highFoxp3− T follicular helper (TFH) cells and CD4+CXCR5highPD-1highFoxp3+ follicular regulatory (TFR) cells. (e) Il21 and Il4 mRNA measured by quantitative PCR from sorted cells using the strategy described in (d) normalized to Gapdh. Heights of the bars represent the mean and error bars represent the range of expression from 3 biological replicates. nd: gene expression not detected. (f) Left: Intracellular expression of CD40L as determined by flow cytometry in Treg (blue), TFH (green) and TFR (red) cell populations; the grey histogram represents a staining control from an immunized CD40L-deficient mouse. Right: Cxcl13 mRNA measured by quantitative RT-PCR as described in (e). (g) Cell surface expression of GITR, CD25 and intracellular CTLA4 in Treg (blue), TFH (green) and TFR (red) cell populations; grey histograms represent the isotype control. (h) Relative Gzmb and Gzma mRNA determined by quantitative RT-PCR as described in (e). (i) Percentage of CD103+ cells within the Treg, TFH & TFR populations, each symbol represents one mouse. (j) Left: Cell surface expression of ICOS as determined by flow cytometry in Treg (blue), TFH (green) and TFR (red) cell populations; the grey histogram represents staining level of an isotype control. Right: Il10 mRNA detected by quantitative RT-PCR of as described in (e). Flow cytometric and RT-PCR data are representative of at least three independent experiments. In (e)-(i): Statistical significance was determined using a one-way ANOVA analysis with Bonferroni’s multiple testing correction; * P<0.05; **P<0.01; ***P<0.001.
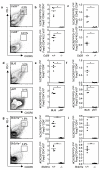
Figure 2. TFR require the same differentiation cues as TFH cells for their development
Flow cytometric contour plots (a, d, g) and dot plots of TFH (b, e, h) and TFR (c, f, i) cells in the groups of mice described below, seven days after SRBC immunization. (a-c) Mixed bone marrow chimeras generated by sub-lethally irradiating Rag2−/− mice and reconstituting their immune system with a 1:1 ratio of bone marrow cells from CD45.1 Cd28+/+ and CD45.2 Cd28−/− mice or control CD45.1 Cd28+/+ and CD45.2 Cd28+/+. (d-f) C57BL/6 (BL/6) and B-cell deficient μMT mice. (g-i) Sh2d1a+/+ and Sh2d1a−/− mice. Each symbol represents one mouse and horizontal bars represent median values. Figures represent one of 3 independent experiments with similar results. Statistical significance was determined using a Mann-Whitney Test: *P<0.05, **P<0.01.
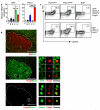
Figure 3. TFR cells express Bcl-6 and Blimp-1
(a) Bcl6 and Prdm1 mRNA normalized to Gapdh determined by quantitative RT-PCR from sorted cells using the strategy described in Fig. 1d and Supplementary Fig. 1. Heights of the bars represent the mean and error bars represent the range of expression from 3 biological replicates. Statistical significance was determined using a one-way ANOVA analysis with Bonferroni’s multiple testing correction; * P<0.05; **P<0.01; ***P<0.001. Bar graphs are representative of 3 experiments. (b) Immunofluorescence of frozen spleen sections from mice immunized seven days previously with SRBC. The germinal center is demarcated by the white dotted line in the three consecutive sections. Upper panel: AID (red) and CD3 (green); middle panel: Foxp3 (red) and Bcl-6 (green); lower panel: Foxp3 (red) and Blimp1 (green). Scale bar represents 100μm. (c) Flow cytometric contour plots of TFH (upper panels) & TFR (lower panels) formation in the draining (mediastinal) lymph node ten days after intranasal influenza infection of mixed fetal liver chimeras reconstituted with a 1:1 ratio of fetal liver cells from E14.5 CD45.2 Prdm1gfp/gfp : CD45.1 Prdm1+/+ embryos, E14.5 CD45.2 Bcl6−/− : CD45.1 Bcl6+/+ embryos or control E14.5 CD45.2 Prdm1gfp/+ : CD45.1 Prdm1+/+ embryos.
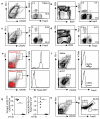
Figure 4. TFR derive from Foxp3+ precursors
Flow cytometric contour plots of splenic CD4+CXCR5highPD-1high cells (a) or CD4+ cells (b) seven days after 1×10⁵ transferred transgenic TCR3A9 HEL-specific CD45.1 T cells were adoptively transferred into congenically distinct CD45.2 B10.Br mice and immunized with HEL in alum. Flow cytometric contour plots of splenic CD4+CXCR5highPD-1high cells (c) or CD4+ cells (d) seven days after adoptive transfer of 1×10⁵ OT-II OVA-specific Thy1.2 T cells into congenically distinct Thy1.1 C57BL6 mice and immunization with OVA in alum. (e) Flow cytometric contour plots of splenic CD4+ T cells from CD45.1 C57BL/6 mice seven days after adoptive transfer of 1×10⁶ sorted naïve CD4+CD44intFoxp3+ Treg (top panel) or CD4+CD44lowFoxp3− naïve T cells (lower panel) from unimmunized CD45.2 Foxp3GFP mice and KLH in Ribi immunization. Transferred CD45.2 cells are shown in red, the endogenous CD45.1 cells are represented by the grey contour plots. Histograms showing Foxp3-GFP expression in transferred CD45.2+CD4+CXCR5highPD-1high cells. (f) Contour plots of splenic CD4+ T cells and quantification of TFR cells (g) from Foxp3DTR mice six days after SRBC immunization and administration of either 0.9% saline (top panel) or DT (lower panel). Histograms show Foxp3+ cells within the CD4+CXCR5highPD-1high compartment. (h) Flow cytometric contour plots of splenic CD4+ cells from Foxp3-cre x ROSA-Stop-flox-YFP mice immunized seven days previously with SRBC (left panel). Enumeration of the proportion of CD4+CXCR5highPD-1high cells that expressed YFP and/or Foxp3 (right panel). Each symbol represents one mouse and horizontal bars represent median values. Figures are representative of 2-4 independent experiments.
Figure 5. TFR regulate the size of the TFH population
Flow cytometric contour plots and graphs of TFH cells (a) and germinal center B cells (b) from the spleens of Foxp3DTR mice immunized eight days previously (d0) with SRBC. Five days after immunization the mice were treated with either DT or saline. (c-f) Analysis of mixed bone marrow chimeras generated by sub-lethally irradiating Rag2−/− mice and reconstituting their immune system with either a 1:1 ratio of Sh2d1a−/− CD45.2 : Foxp3DTR CD45.1 bone marrow or control Sh2d1a+/+ CD45.2 : Foxp3DTR CD45.1 bone marrow. Eight weeks after reconstitution chimeric mice were immunized with SRBC and treated with 50μg/Kg of DT on one day prior to immunization and d2 and d5 thereafter. Splenocytes were analyzed on d8 for the proportion and total number of CD4+CXCR5highPD-1highFoxp3+ TFR cells (c), CD4+Foxp3+ Treg (d), CD4+CXCR5highPD-1high TFH cells (e) and B220+ GL-7highCD95high germinal center B cells (f). Each symbol represents one mouse and horizontal bars represent median values. Statistical significance was determined using a Mann-Whitney Test: *P<0.05, **P<0.01.
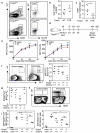
Figure 6. TFR restrict the outgrowth of non-antigen specific clones in the germinal center
Flow cytometric contour plots (a) and graphs (b) of total GL-7+CD95+ germinal center B cells and (c) NP+ germinal center B cells ten days after immunization of Foxp3WT and Foxp3DTR mice that have been treated with DT 6 days after NP-KLH immunization. Statistical analyses performed using Mann Whitney U-test. Experimental outline (d) of immunization and DT or saline treatment scheme of Foxp3DTR mice (n=8 per group) to examine the antigen specific immunoglobulin response over time, mice were bled prior to, and d10, d15, d20 and d28 after primary immunization. Mice were given a booster immunization 24 days after the primary immunization. (e) ELISA analysis of NP12 and NP2 antibodies in the experiment outlined in (d). Error bars represent the standard error of the mean from eight individual mice from one experiment, representative of two experiments. Statistical analyses in (e) were performed using a two-way ANOVA with Bonferroni post test to compare differences at each time point. Graphs and flow cytometric contour plots of NP+ germinal center B cells (f), total GL-7+CD95+ germinal center B cells (g) and NP+ bone marrow plasma and memory cells (h, i) 21 days after NP-CGG immunization of chimeric mice generated by reconstituting Rag2−/− mice with a 1:1 mix of Sh2d1a−/−:Foxp3−/−, Sh2d1a+/+:Foxp3+/+, Sh2d1a+/+:Foxp3−/− and Sh2d1a−/−:Foxp3+/+ fetal liver. Statistical analyses in (f, g, h and i) were performed using a one-way ANOVA with Bonferroni post test correction. Each symbol represents one mouse and horizontal bars represent median values. *P<0.05, **P<0.01, ***P<0.001.
Comment in
- Treg cells: patrolling a dangerous neighborhood.
Campbell DJ, Koch MA. Campbell DJ, et al. Nat Med. 2011 Aug 4;17(8):929-30. doi: 10.1038/nm.2433. Nat Med. 2011. PMID: 21818088 No abstract available. - Regulatory T cells: Pursuing a germinal centre career.
Papatriantafyllou M. Papatriantafyllou M. Nat Rev Immunol. 2011 Sep;11(9):572. doi: 10.1038/nri3053. Nat Rev Immunol. 2011. PMID: 21970029 No abstract available.
Similar articles
- Follicular regulatory T cells expressing Foxp3 and Bcl-6 suppress germinal center reactions.
Chung Y, Tanaka S, Chu F, Nurieva RI, Martinez GJ, Rawal S, Wang YH, Lim H, Reynolds JM, Zhou XH, Fan HM, Liu ZM, Neelapu SS, Dong C. Chung Y, et al. Nat Med. 2011 Jul 24;17(8):983-8. doi: 10.1038/nm.2426. Nat Med. 2011. PMID: 21785430 Free PMC article. - Regulation of the germinal center reaction by Foxp3+ follicular regulatory T cells.
Wollenberg I, Agua-Doce A, Hernández A, Almeida C, Oliveira VG, Faro J, Graca L. Wollenberg I, et al. J Immunol. 2011 Nov 1;187(9):4553-60. doi: 10.4049/jimmunol.1101328. Epub 2011 Oct 7. J Immunol. 2011. PMID: 21984700 - Treg cells: patrolling a dangerous neighborhood.
Campbell DJ, Koch MA. Campbell DJ, et al. Nat Med. 2011 Aug 4;17(8):929-30. doi: 10.1038/nm.2433. Nat Med. 2011. PMID: 21818088 No abstract available. - IL-21 and T follicular helper cells.
Spolski R, Leonard WJ. Spolski R, et al. Int Immunol. 2010 Jan;22(1):7-12. doi: 10.1093/intimm/dxp112. Epub 2009 Nov 23. Int Immunol. 2010. PMID: 19933709 Free PMC article. Review. - T cell immune response within B-cell follicles.
Huang Q, Xu L, Ye L. Huang Q, et al. Adv Immunol. 2019;144:155-171. doi: 10.1016/bs.ai.2019.08.008. Epub 2019 Sep 16. Adv Immunol. 2019. PMID: 31699216 Review.
Cited by
- Immunosuppression Has Long-Lasting Effects on Circulating Follicular Regulatory T Cells in Kidney Transplant Recipients.
Niu Q, Mendoza Rojas A, Dieterich M, Roelen DL, Clahsen-van Groningen MC, Wang L, van Gelder T, Hesselink DA, van Besouw NM, Baan CC. Niu Q, et al. Front Immunol. 2020 Aug 28;11:1972. doi: 10.3389/fimmu.2020.01972. eCollection 2020. Front Immunol. 2020. PMID: 32983131 Free PMC article. - microRNA-17-92 regulates IL-10 production by regulatory T cells and control of experimental autoimmune encephalomyelitis.
de Kouchkovsky D, Esensten JH, Rosenthal WL, Morar MM, Bluestone JA, Jeker LT. de Kouchkovsky D, et al. J Immunol. 2013 Aug 15;191(4):1594-605. doi: 10.4049/jimmunol.1203567. Epub 2013 Jul 15. J Immunol. 2013. PMID: 23858035 Free PMC article. - Stat3 Is Important for Follicular Regulatory T Cell Differentiation.
Wu H, Xie MM, Liu H, Dent AL. Wu H, et al. PLoS One. 2016 May 5;11(5):e0155040. doi: 10.1371/journal.pone.0155040. eCollection 2016. PLoS One. 2016. PMID: 27148746 Free PMC article. - Adaptive immune system in pulmonary sarcoidosis-Comparison of peripheral and alveolar biomarkers.
d'Alessandro M, Bergantini L, Cameli P, Mezzasalma F, Refini RM, Pieroni M, Sestini P, Bargagli E. d'Alessandro M, et al. Clin Exp Immunol. 2021 Sep;205(3):406-416. doi: 10.1111/cei.13635. Epub 2021 Jul 7. Clin Exp Immunol. 2021. PMID: 34107064 Free PMC article. - Differentiation, functions, and roles of T follicular regulatory cells in autoimmune diseases.
Hao H, Nakayamada S, Tanaka Y. Hao H, et al. Inflamm Regen. 2021 May 3;41(1):14. doi: 10.1186/s41232-021-00164-9. Inflamm Regen. 2021. PMID: 33934711 Free PMC article. Review.
References
- Vinuesa CG, Sanz I, Cook MC. Dysregulation of germinal centres in autoimmune disease. Nature Reviews. 2009;9:845–857. - PubMed
Publication types
MeSH terms
Substances
LinkOut - more resources
Full Text Sources
Other Literature Sources
Research Materials
Miscellaneous
