The organization of the human cerebellum estimated by intrinsic functional connectivity - PubMed (original) (raw)
The organization of the human cerebellum estimated by intrinsic functional connectivity
Randy L Buckner et al. J Neurophysiol. 2011 Nov.
Abstract
The cerebral cortex communicates with the cerebellum via polysynaptic circuits. Separate regions of the cerebellum are connected to distinct cerebral areas, forming a complex topography. In this study we explored the organization of cerebrocerebellar circuits in the human using resting-state functional connectivity MRI (fcMRI). Data from 1,000 subjects were registered using nonlinear deformation of the cerebellum in combination with surface-based alignment of the cerebral cortex. The foot, hand, and tongue representations were localized in subjects performing movements. fcMRI maps derived from seed regions placed in different parts of the motor body representation yielded the expected inverted map of somatomotor topography in the anterior lobe and the upright map in the posterior lobe. Next, we mapped the complete topography of the cerebellum by estimating the principal cerebral target for each point in the cerebellum in a discovery sample of 500 subjects and replicated the topography in 500 independent subjects. The majority of the human cerebellum maps to association areas. Quantitative analysis of 17 distinct cerebral networks revealed that the extent of the cerebellum dedicated to each network is proportional to the network's extent in the cerebrum with a few exceptions, including primary visual cortex, which is not represented in the cerebellum. Like somatomotor representations, cerebellar regions linked to association cortex have separate anterior and posterior representations that are oriented as mirror images of one another. The orderly topography of the representations suggests that the cerebellum possesses at least two large, homotopic maps of the full cerebrum and possibly a smaller third map.
Figures
Fig. 1.
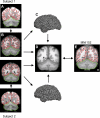
Hybrid surface- and volume-based registration. For each subject, the T2* images yielding blood oxygenation level-dependent (BOLD)-contrast functional magnetic resonance imaging (fMRI) data (A) were registered to the T1-weighted structural data (B) in the subject's native space. The cerebral surface and cerebellar boundary were estimated based on the structural data and projected to the BOLD data. The red lines show the estimated inner boundary of the cerebral cortical surface at the gray-white interface. The green line shows the estimated edge of the cerebellum. The cerebral cortical surface was then extracted (C) and aligned between subjects using surface-based registration. The T1-weighted structural data were also aligned between subjects using nonlinear volume-based registration (D). The surface and volume were then registered to the Montreal Neurological Institute (MNI) atlas space (E) for visualization and coordinate reporting.
Fig. 2.
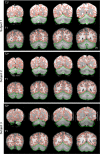
Examples of within-subject surface and volume extraction. Examples of the extracted cerebral cortex surface and cerebellum boundaries are shown for 3 typical subjects within their native space. The green line shows the estimate edge of the cerebellum tailored to each individual subject's T1-weighted image to illustrate deviations in the T2* images. Imperfections are apparent in the BOLD data, especially in regions prone to susceptibility artifact (e.g., inferior temporal cortex).
Fig. 3.
Examples of between-subject cerebellar alignment. Volumetric alignment is illustrated for the structural data from 3 typical subjects. The green line represents a loose-fitting cerebellar edge estimated from the group template and is displayed identically across the 3 subjects as a reference to illustrate how each individual conforms to the group template. Each subject's cerebellum is well registered in relation to the template. Close examination reveals subtle differences between subjects reflecting alignment errors on the order of a few millimeters. There was no attempt to align the details of the folia between subjects.
Fig. 4.
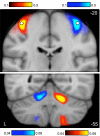
Functional connectivity of the cerebral motor hand region reveals contralateral somatomotor regions of the cerebellum. Coronal sections (top, y = −20; bottom, y = −55) display functional connectivity for the direct contrast between seed motor regions placed in the left and right hand regions of 1,000 subjects (white circles in top section display the region locations). Each panel shows connectivity maps for a different coronal section (top: y = −20 mm, the section containing the hand region of M1; bottom: y = −55 mm, the section containing the cerebellar hand representation). Red colors display connectivity of the right motor seed region subtracted from the left motor seed region; blue colors display the reverse subtraction. Note the crossed lateralization and double representation in the cerebellum, including the strong primary somatomotor representation in the anterior lobe (top) and the slightly weaker secondary representation in the posterior lobe (bottom). Color bars indicate the correlation strength [z(r)]. The correlation strength near to the seed regions (top) is considerably stronger than the distant correlations (bottom), necessitating plotting the data using different scales. The left hemisphere is displayed at left (neurological convention).
Fig. 5.
Functional connectivity reveals inverted somatomotor topography within the anterior lobe of the cerebellum that is comparable to task-evoked estimates. A: the cerebral (right hemisphere) and cerebellar (left hemisphere) locations of the hind paw (green), forepaw (red), and face (blue) somatomotor representations in the monkey are known from physiological responses to stimulation. Note that the representation of body space is inverted in the anterior lobe. [Adapted from Adrian (1943).] B: the cerebral somatomotor topography evoked by foot (green), hand (red), and tongue (blue) movements as measured by task fMRI in the human. C: the inverted somatomotor topography is clearly present in the anterior lobe of the contralateral cerebellum. D: right cerebral seed regions were defined based on the task activation data in B and reflected across the midline. The seed regions are illustrated for the right hemisphere to show their positions relative to the left hemisphere task data. E: the somatomotor map in the cerebellum is displayed based exclusively on functional connectivity MRI (fcMRI) with the contralateral cerebrum. The inverted somatomotor topography is present and similar to the task-based estimates, suggesting functional connectivity can resolve distinct regions of body space within the cerebellum. F: 3 views of somatomotor representation within the cerebellum are illustrated. Each estimate comes from a bilateral cerebral region and represents the extent of the functionally coupled response thresholded at r = 0.04. Displayed coordinates represent the plane in MNI atlas space. Note that the anterior lobe representation is inverted with the foot anterior to the hand and tongue, whereas the posterior lobe representation is upright with the tongue anterior to the hand and foot.
Fig. 6.
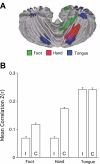
Asymmetry of somatomotor representations. A: the task-based somatomotor representation is displayed for both the left and right hemispheres of the cerebellum. The tongue representation is bilateral, whereas the hand and foot are lateralized. B: functional correlation strengths are plotted for the ipsilateral (I) and contralateral (C) cerebrocerebellar region pairs based exclusively on functional connectivity. Error bars display standard error of the mean. Note that the foot and hand are lateralized, with the hand strongly lateralized. The tongue representation is bilateral. The lateralization-by-region interaction is significant (P < 0.001), indicating that intrinsic functional correlations show differential lateralization across the body map paralleling the task-based estimates.
Fig. 7.
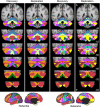
Reliability of maps of the human cerebellum based on functional connectivity. Every voxel within the cerebellum is colored based on its maximal functional correlation with a cerebral network in the discovery sample (n = 500) and replicated in the replication sample (n = 500). The 2 left columns display the parcellation based on the 7 cerebral networks shown at bottom left (from Yeo et al. 2011). For example, the blue regions of the cerebellum include those voxels that are more strongly correlated with the blue cerebral network (involving somatosensory and motor cortices) than any other network. The 2 right columns display the parcellation based on the 17 cerebral networks shown at bottom right (from Yeo et al. 2011). Note that the discovery and replication maps are highly similar.
Fig. 8.
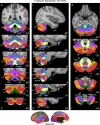
A map of the human cerebellum based on functional connectivity to 7 major networks in the cerebrum. Every voxel within the cerebellum is colored based on its maximal functional correlation with a cerebral network in the full sample of 1,000 individuals. The map is based on the 7 cerebral networks shown at bottom (from Yeo et al. 2011). The sections display coronal (right), saggittal (middle), and transverse (left) images: A, anterior; P, posterior; L, left; R, right; S, superior; and I, inferior. The coordinates at bottom right of each panel represent the section level in the MNI atlas space. Major fissures are demarcated on the left hemisphere, and lobules are labeled on the right hemisphere. AF, ansoparamedian fissure; HF, horizontal fissure; IbF, intrabiventer fissure; IcF, intraculminate fissure; PbF, prepyramidal/prebiventer fissure; PF, primary fissure; PLF, posterolateral fissure; PrcF, preculminate fissure; SF, secondary fissure; SPF, superior posterior fissure. Note that this mapping method identifies the correct locations of the primary and secondary somatomotor regions in the anterior and posterior lobes of the cerebellum (shown in blue). The cerebellar hemispheres primarily map to cerebral networks involving association cortex (as exemplified by the networks illustrated in red and orange).
Fig. 9.
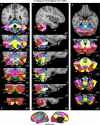
A fine-parcellated map of the human cerebellum based on functional connectivity to 17 networks in the cerebrum. The format and abbreviations are the same as in Fig. 8 but in this instance are in relation to a finer cerebral parcellation involving 17 networks (from Yeo et al. 2011). These data are from the full sample of 1,000 individuals.
Fig. 10.
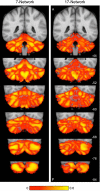
Confidence of the parcellation estimates. Confidence (silhouette) values for each voxel of the cerebellum with respect to its assigned network are displayed for the 7 (left)- and 17-network (right) estimates. Estimation of the silhouette values are described in Yeo et al. (2011). Much like the cerebral parcellation (see Yeo et al. 2011), regions near network boundaries are less confident.
Fig. 11.
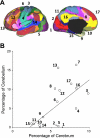
Quantitative relation between the extent of cerebral and cerebellar cortices dedicated to distinct functional networks. The percentage of cerebral surface area dedicated to each network is plotted against the volumetric percentage of the cerebellar gray matter dedicated to the same network. These estimates are based on 1,000 subjects. A: the reference map is illustrated with numbers identifying the estimated networks. B: the quantitative relation is plotted with the best-fit line. Open circles represent individual networks, with their networks labeled by numbers corresponding to A. The x's represent networks whose cortical partners are used in regression (e.g., visual cortex), possibly biasing analysis (see Fig. 12 for elaboration).
Fig. 12.
Evidence that the human cerebellum does not show functional connectivity with primary visual and auditory cortices. Functional connectivity between the primary visual cortex and the cerebellum was examined in detail. A: 2 primary visual cortex regions were selected based on postmortem histological estimates on V1 projected onto the cortical surface reference. V1p, peripheral representation of V1; V1c, central representation of V1. Shaded yellow areas represent the surface projection of histologically estimated V1. A region near auditory cortex (right) was also selected. B: functional connectivity maps for each seed region without (no regress) and with regression of the visual signal near the cerebellum (vis regress). Regression was removed to ensure that the map is not underestimating the representation of visual or auditory regions within the cerebellum. There is no evidence for representation of primary visual or auditory cortices within the cerebellum except for cerebellar cortex just adjacent to visual cortex (marked by an asterisk in leftmost column).
Fig. 13.
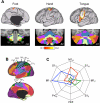
Cerebrocerebellar circuits involved in somatomotor networks demonstrate topographic specificity. A: left cerebral cortex connectivity maps are shown for right seed regions within the estimated foot, hand, and tongue representations of the anterior lobe of the cerebellum. The surface maps show the entirety of the functional connectivity pattern (threshold r = 0.1). The dark lines on the cortical surface represent the boundaries of the 7 cortical networks, plotted for reference. The locations of the cerebellar seed regions are shown below each map. B: left cerebral regions are displayed that were used for quantitative assessment of specificity. Right cerebral regions obtained from reflecting left cerebral regions across the midline are not shown. PrCv, ventral precentral cortex; FEF, frontal eye field. Subscripts H, F, and T indicate hand, foot, and tongue representations in M1 and S1 cortex. C: quantitative measures of functional connectivity strength are plotted in polar form for cerebellar anterior lobe seed regions linked to the foot (green line), hand (red line), and tongue (blue line) representations. Functional connectivity strengths were computed between contralateral cerebral and cerebellar regions and averaged across the hemispheres. The polar scale ranges from r = −0.05 (center) to r = 0.25 (outer boundary) in 0.1-step increments.
Fig. 14.
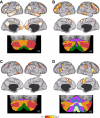
Evidence for specificity of cerebrocerebellar circuits involving association cortex. The strategy for exploring and quantifying the specificity of somatomotor circuits in Fig. 13 is generalized to distributed regions of association cortex. A–D each display the whole brain cerebral surface connectivity pattern for a specific set of bilateral cerebellar seed regions (shown below each map). Cortical maps are displayed based on functional connectivity with contralateral cerebellar regions. Note that separate regions of the cerebellum are selectively correlated with distinct cerebral association networks, including those linked to higher level cognition.
Fig. 15.
Quantitative evaluation of the specificity of cerebrocerebellar circuits involving association cortex. A: reference regions used for quantitative analysis of association cortex. PCC, posterior cingulate cortex; PFC, prefrontal cortex; STS, superior temporal sulcus. B–D: polar plots of functional connectivity strength for each of the seed regions from Fig. 14. Note that each polar plot has a distinct connectivity profile. The red lines display functional connectivity strength between the left cerebellar seed regions and right cerebral cortex seed regions, and the blue lines display the contralateral pairings. The similarity between the red and blue lines shows that the coupling profiles are reliable between the hemispheres. For B and C, the polar scale ranges from r = −0.2 (center) to r = 0.3 (outer boundary) in 0.1-step increments. For D and E, the polar scale ranges from r = −0.15 (center) to r = 0.2 (outer boundary) in 0.05-step increments.
Fig. 16.
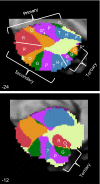
The cerebellum possesses multiple representations of the cerebral cortex. The topographic orderings of the cerebral networks are illustrated for 2 sagittal sections of the left cerebellum (x = −24 and x = −12). The parcellation is derived from the full data sample (n = 1,000). Letters are displayed to aid visualization of the representation ordering. F, foot; H, hand; T, tongue; P, purple network; G, green network; O, orange network; R, red network. The colored networks refer to the 7-network parcellation (Fig. 8), and the somatomotor topography refers to the ordering as estimated in Fig. 5. G* refers to the minimal green network in the x = −24 section, which is better illustrated in Fig. 8 (x =−8). G− is highlighted because it does not follow the expected topographic pattern but rather may be an erroneous mapping, because it is located on the border between the cerebellum and cerebral cortex within a region of uncertain mapping (see Fig. 10). The white lines demarcate estimated boundaries between the maps and do not have significance in relation to sulcal boundaries. Three distinct representations are observed, labeled the primary, secondary, and tertiary representations. Each is a mirror-image ordering of the adjacent map. The question mark in the tertiary representation indicates the uncertain beginning point, if it does exist, of a third somatomotor representation. R* refers to the red network, which can be seen in the x = −12 section but not the x = −24 section. What appears initially as a complex pattern may be parsimoniously explained by the hypothesis that the major portion of the cerebellum contains a double, inverted representation of the entire cerebral cortex and then a potential tertiary representation in its most posterior extent. The classic observation of primary and secondary somatomotor representation in the anterior and posterior lobes may be the beginning and end points of much larger maps.
Similar articles
- A third somatomotor representation in the human cerebellum.
Saadon-Grosman N, Angeli PA, DiNicola LM, Buckner RL. Saadon-Grosman N, et al. J Neurophysiol. 2022 Oct 1;128(4):1051-1073. doi: 10.1152/jn.00165.2022. Epub 2022 Sep 21. J Neurophysiol. 2022. PMID: 36130164 Free PMC article. - The detailed organization of the human cerebellum estimated by intrinsic functional connectivity within the individual.
Xue A, Kong R, Yang Q, Eldaief MC, Angeli PA, DiNicola LM, Braga RM, Buckner RL, Yeo BTT. Xue A, et al. J Neurophysiol. 2021 Feb 1;125(2):358-384. doi: 10.1152/jn.00561.2020. Epub 2020 Dec 2. J Neurophysiol. 2021. PMID: 33427596 Free PMC article. - The organization of the human striatum estimated by intrinsic functional connectivity.
Choi EY, Yeo BT, Buckner RL. Choi EY, et al. J Neurophysiol. 2012 Oct;108(8):2242-63. doi: 10.1152/jn.00270.2012. Epub 2012 Jul 25. J Neurophysiol. 2012. PMID: 22832566 Free PMC article. - The cerebellum in the cerebro-cerebellar network for the control of eye and hand movements--an fMRI study.
Nitschke MF, Arp T, Stavrou G, Erdmann C, Heide W. Nitschke MF, et al. Prog Brain Res. 2005;148:151-64. doi: 10.1016/S0079-6123(04)48013-3. Prog Brain Res. 2005. PMID: 15661188 Review. - Neuronal plasticity of interrelated cerebellar and cortical networks.
Molinari M, Filippini V, Leggio MG. Molinari M, et al. Neuroscience. 2002;111(4):863-70. doi: 10.1016/s0306-4522(02)00024-6. Neuroscience. 2002. PMID: 12031409 Review.
Cited by
- Chronic Sleep Deprivation Altered the Expression of Memory-Related Genes and Caused Cognitive Memory Dysfunction in Mice.
Wang X, Chen H, Tang T, Zhan X, Qin S, Hang T, Song M. Wang X, et al. Int J Mol Sci. 2024 Oct 29;25(21):11634. doi: 10.3390/ijms252111634. Int J Mol Sci. 2024. PMID: 39519186 Free PMC article. - Within-individual organization of the human cognitive cerebellum: Evidence for closely juxtaposed, functionally specialized regions.
Saadon-Grosman N, Du J, Kosakowski HL, Angeli PA, DiNicola LM, Eldaief MC, Buckner RL. Saadon-Grosman N, et al. Sci Adv. 2024 Nov 8;10(45):eadq4037. doi: 10.1126/sciadv.adq4037. Epub 2024 Nov 8. Sci Adv. 2024. PMID: 39514652 Free PMC article. - Individual-level metabolic connectivity from dynamic [18F]FDG PET reveals glioma-induced impairments in brain architecture and offers novel insights beyond the SUVR clinical standard.
Vallini G, Silvestri E, Volpi T, Lee JJ, Vlassenko AG, Goyal MS, Cecchin D, Corbetta M, Bertoldo A. Vallini G, et al. Eur J Nucl Med Mol Imaging. 2024 Oct 30. doi: 10.1007/s00259-024-06956-8. Online ahead of print. Eur J Nucl Med Mol Imaging. 2024. PMID: 39472368 - Adverse childhood experiences, brain function, and psychiatric diagnoses in a large adult clinical cohort.
Keator DB, Salgado F, Madigan C, Murray S, Norris S, Amen D. Keator DB, et al. Front Psychiatry. 2024 Oct 14;15:1401745. doi: 10.3389/fpsyt.2024.1401745. eCollection 2024. Front Psychiatry. 2024. PMID: 39469474 Free PMC article. - Social and emotional learning in the cerebellum.
Van Overwalle F. Van Overwalle F. Nat Rev Neurosci. 2024 Dec;25(12):776-791. doi: 10.1038/s41583-024-00871-5. Epub 2024 Oct 21. Nat Rev Neurosci. 2024. PMID: 39433716 Review.
References
- Adrian ED. Afferent areas in the cerebellum connected with the limbs. Brain 66: 289–315, 1943
- Allen G, McColl R, Barnard H, Ringe WK, Fleckenstein J, Cullum CM. Magnetic resonance imaging of the cerebellar-prefrontal and cerebellar-parietal functional connectivity. Neuroimage 28: 39–48, 2005 - PubMed
- Amunts K, Malikovic A, Mohlberg H, Schormann T, Zilles K. Brodmann's areas 17 and 18 brought into stereotaxic space—where and how variable? Neuroimage 11: 66–84, 2000 - PubMed
Publication types
MeSH terms
Grants and funding
- K08 MH067966/MH/NIMH NIH HHS/United States
- P41 RR14074/RR/NCRR NIH HHS/United States
- AG021910/AG/NIA NIH HHS/United States
- U54MH091665/MH/NIMH NIH HHS/United States
- HHMI/Howard Hughes Medical Institute/United States
LinkOut - more resources
Full Text Sources
Other Literature Sources
Medical
