Therapeutic impact of leptin on diabetes, diabetic complications, and longevity in insulin-deficient diabetic mice - PubMed (original) (raw)
. 2011 Sep;60(9):2265-73.
doi: 10.2337/db10-1795. Epub 2011 Aug 1.
Affiliations
- PMID: 21810600
- PMCID: PMC3161331
- DOI: 10.2337/db10-1795
Therapeutic impact of leptin on diabetes, diabetic complications, and longevity in insulin-deficient diabetic mice
Masaki Naito et al. Diabetes. 2011 Sep.
Abstract
Objective: The aim of the current study was to evaluate the long-term effects of leptin on glucose metabolism, diabetes complications, and life span in an insulin-dependent diabetes model, the Akita mouse.
Research design and methods: We cross-mated Akita mice with leptin-expressing transgenic (LepTg) mice to produce Akita mice with physiological hyperleptinemia (LepTg:Akita). Metabolic parameters were monitored for 10 months. Pair-fed studies and glucose and insulin tolerance tests were performed. The pancreata and kidneys were analyzed histologically. The plasma levels and pancreatic contents of insulin and glucagon, the plasma levels of lipids and a marker of oxidative stress, and urinary albumin excretion were measured. Survival rates were calculated.
Results: Akita mice began to exhibit severe hyperglycemia and hyperphagia as early as weaning. LepTg:Akita mice exhibited normoglycemia after an extended fast even at 10 months of age. The 6-h fasting blood glucose levels in LepTg:Akita mice remained about half the level of Akita mice throughout the study. Food intake in LepTg:Akita mice was suppressed to a level comparable to that in WT mice, but pair feeding did not affect blood glucose levels in Akita mice. LepTg:Akita mice maintained insulin hypersensitivity and displayed better glucose tolerance than did Akita mice throughout the follow-up. LepTg:Akita mice had normal levels of plasma glucagon, a marker of oxidative stress, and urinary albumin excretion rates. All of the LepTg:Akita mice survived for >12 months, the median mortality time of Akita mice.
Conclusions: These results indicate that leptin is therapeutically useful in the long-term treatment of insulin-deficient diabetes.
Figures
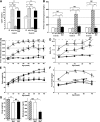
FIG. 1.
Time course of changes in plasma leptin, blood glucose, HbA1c, body weight, and food intake. A: Plasma leptin levels of WT, LepTg, Akita, and LepTg:Akita mice at 8 and 28 weeks of age (n ≥4 in each group). B: Sixteen-hour fasting blood glucose levels of WT, LepTg, Akita, and LepTg:Akita mice at 8, 18, and 43 weeks of age (n ≥4 in each group). C: Time course of 6-h fasting blood glucose concentrations of WT (◇), LepTg (♦), Akita (○), and LepTg:Akita (●) mice (n ≥11 in each group, except n = 5 for data of 40 weeks of age). Since the glucometer has a detection limit up to 600 mg/dL, values above the detection limit were treated as 601 mg/dL. Dashed line indicates detection limit of 600 mg/dL. The numbers along the curves indicate the percent of samples above detection limit. D: Time course of glycated hemoglobin (HbA1c) levels of WT (◇), LepTg (♦), Akita (○), and LepTg:Akita (●) mice (n ≥4 in each group). Since the analyzer has a detection limit up to 14%, values above the detection limit were treated as 14.1%. Dashed line indicates detection limit of 14%. The numbers along the curves indicate the percent of samples above detection limit. E: Time course of body weight changes of WT (◇), LepTg (♦), Akita (○), and LepTg:Akita (●) mice (n ≥ 11 in each group, except n = 5 for data of 40 weeks of age). F: Time course of 24-h food intake of WT (◇), LepTg (♦), Akita (○), and LepTg:Akita (●) mice (n ≥ 11 in each group, except n = 4 for data of 40 weeks of age). G: Body weight of Akita, pair-fed Akita, and LepTg:Akita mice at the end of 3 weeks of pair feeding (n = 4 in each group). H: Six-hour fasting blood glucose concentrations of Akita, pair-fed Akita, and LepTg:Akita mice at the end of 3 weeks of pair feeding (n = 4 in each group). Data are expressed as means ± SE. In A_–_F, †P < 0.05, ††P < 0.01 for WT vs. LepTg, §P < 0.05, §§P < 0.01 for WT vs. Akita, ‡P < 0.05, ‡‡P < 0.01 for WT vs. LepTg:Akita, ¶¶P < 0.01 for LepTg vs. Akita, ★★P < 0.01 for LepTg vs. LepTg:Akita, *P < 0.05, and **P < 0.01 for Akita vs. LepTg:Akita. In G and H, ##P < 0.01 for Akita vs. pair-fed Akita and **P < 0.01 for LepTg:Akita vs. pair-fed Akita.
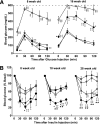
FIG. 2.
GTTs and ITTs. A: GTTs of WT (◇), LepTg (♦), Akita (open circles), and LepTg:Akita (closed circles) mice at 8 and 16 weeks of age. Blood glucose levels are shown at indicated times after glucose injections (1 g/kg body wt i.p.; n ≥4 in each group). B: ITTs of WT (◇), LepTg (♦), Akita (○), and LepTg:Akita (●) mice at 8, 18, and 28 weeks of age. Percent changes in blood glucose levels are shown at indicated times after injection of insulin (0.5 units/kg body wt i.p.; n ≥ 4 in each group). Dashed line indicates detection limit of 600 mg/dL. Data are expressed as means ± SE. §P < 0.05, §§P < 0.01 for WT vs. Akita, ‡P < 0.05, ‡‡P < 0.01 for WT vs. LepTg:Akita, ★P < 0.05, ★★P < 0.01 for LepTg vs. LepTg:Akita, *P < 0.05, and **P < 0.01 for Akita vs. LepTg:Akita.
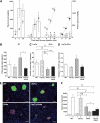
FIG. 3.
Glucose-stimulated insulin secretion, plasma glucagon levels, and pancreatic hormone contents. A: Plasma insulin (open bars) and glucose (black lines) concentrations after glucose (3 g/kg i.p.) injection in WT, LepTg, Akita, and LepTg:Akita mice at 8 weeks of age (n ≥4 in each group). B: Plasma glucagon concentration in ad libitum–fed WT, LepTg, Akita, and LepTg:Akita mice at 22 weeks of age (n ≥4 in each group). C and D: Pancreatic insulin (C) and glucagon (D) content measured in acid-ethanol extracts of homogenized pancreas from WT, LepTg, Akita, and LepTg:Akita mice at 18 weeks of age (n ≥5 in each group). E: Double immunofluorescent stainings against insulin (green) and glucagon (red) in pancreatic sections from WT, LepTg, Akita, and LepTg:Akita mice at the age of 18 weeks. Scale bar indicates 50 μm. F: α-Cell and β-cell areas per islet in WT, LepTg, Akita, and LepTg:Akita mice at 18 weeks of age (n ≥ 4in each group). Data are expressed as means ± SE. ††P < 0.01 for WT vs. LepTg, §§P < 0.01 for WT vs. Akita, ‡P < 0.05, ‡‡P < 0.01 for WT vs. LepTg:Akita, ¶P < 0.05, ¶¶P < 0.01 for LepTg vs. Akita, ★P < 0.05, ★★P < 0.01 for LepTg vs. LepTg:Akita, *P < 0.05, and **P < 0.01 for Akita vs. LepTg:Akita. (A high-quality digital representation of this figure is available in the online issue.)
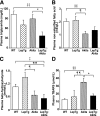
FIG. 4.
Plasma levels of TG, NEFA, β-hydroxybutyrate, and TBARS. A and B: Fasting plasma levels of TG (A) and NEFA (B) concentrations in WT, LepTg, Akita, and LepTg:Akita mice at 18 weeks of age (n ≥4 in each group). C: Fasting plasma levels of β-hydroxybutyrate concentrations in WT, LepTg, Akita, and LepTg:Akita mice at 11 weeks of age (n ≥4 in each group). D: Fasting plasma levels of TBARS concentrations in WT, LepTg, Akita, and LepTg:Akita mice at 18 weeks of age (n ≥4 in each group). Data are expressed as means ± SE. §§P < 0.01 for WT vs. Akita, ‡P < 0.05, ‡‡P < 0.01 for WT vs. LepTg:Akita, ¶P < 0.05, ¶¶P < 0.01 for LepTg vs. Akita, ★★P < 0.01 for LepTg vs. LepTg:Akita, and *P < 0.05 for Akita vs. LepTg:Akita.
FIG. 5.
Urinary albumin excretion and histology of glomeruli. A: Time course of urinary albumin excretion of WT (◇), LepTg (♦), Akita (○), and LepTg:Akita (●). Data are expressed as means ± SE (n ≥4 in each group). §§P < 0.01 for WT vs. Akita, ¶¶P < 0.01 for LepTg vs. Akita, ★P < 0.01 for LepTg vs. LepTg:Akita, *P < 0.05, and **P < 0.01 for Akita vs. LepTg:Akita. B: PAS-staining of representative glomeruli from WT, LepTg, Akita, and LepTg:Akita mice at 22 weeks of age. Scale bar indicates 50 μm. (A high-quality color representation of this figure is available in the online issue.)
FIG. 6.
Survival rates. Survival curves of Akita (dotted line) and LepTg:Akita (solid line) mice (n ≥11 in each group). Survival rate of Akita mice markedly decreased relative to LepTg:Akita mice (P < 0.01) and was ∼50% at 52 weeks of age.
Similar articles
- Transgenic overexpression of leptin rescues insulin resistance and diabetes in a mouse model of lipoatrophic diabetes.
Ebihara K, Ogawa Y, Masuzaki H, Shintani M, Miyanaga F, Aizawa-Abe M, Hayashi T, Hosoda K, Inoue G, Yoshimasa Y, Gavrilova O, Reitman ML, Nakao K. Ebihara K, et al. Diabetes. 2001 Jun;50(6):1440-8. doi: 10.2337/diabetes.50.6.1440. Diabetes. 2001. PMID: 11375346 - UCP1-independent glucose-lowering effect of leptin in type 1 diabetes: only in conditions of hypoleptinemia.
Zouhar P, Rakipovski G, Bokhari MH, Busby O, Paulsson JF, Conde-Frieboes KW, Fels JJ, Raun K, Andersen B, Cannon B, Nedergaard J. Zouhar P, et al. Am J Physiol Endocrinol Metab. 2020 Jan 1;318(1):E72-E86. doi: 10.1152/ajpendo.00253.2019. Epub 2019 Nov 19. Am J Physiol Endocrinol Metab. 2020. PMID: 31743040 Free PMC article. - Glucose-dependent insulinotropic polypeptide: effects on insulin and glucagon secretion in humans.
Christensen MB. Christensen MB. Dan Med J. 2016 Apr;63(4):B5230. Dan Med J. 2016. PMID: 27034187 Review. - Hypothalamic-mediated control of glucose balance in the presence and absence of insulin.
Fujikawa T, Coppari R. Fujikawa T, et al. Aging (Albany NY). 2014 Feb;6(2):92-7. doi: 10.18632/aging.100641. Aging (Albany NY). 2014. PMID: 24589844 Free PMC article. Review.
Cited by
- Meta-immunological profiling of children with type 1 diabetes identifies new biomarkers to monitor disease progression.
Galgani M, Nugnes R, Bruzzese D, Perna F, De Rosa V, Procaccini C, Mozzillo E, Cilio CM, Elding Larsson H, Lernmark A, La Cava A, Franzese A, Matarese G. Galgani M, et al. Diabetes. 2013 Jul;62(7):2481-91. doi: 10.2337/db12-1273. Epub 2013 Feb 8. Diabetes. 2013. PMID: 23396400 Free PMC article. - Therapeutic mechanisms of mulberry leaves in type 2 diabetes based on metabolomics.
Ma Q, Li Y, Zhao R, Tang Z, Li J, Chen C, Liu X, Hu Y, Wang T, Zhao B. Ma Q, et al. Front Pharmacol. 2022 Aug 30;13:954477. doi: 10.3389/fphar.2022.954477. eCollection 2022. Front Pharmacol. 2022. PMID: 36110521 Free PMC article. - The insulin regulatory network in adult hippocampus and pancreatic endocrine system.
Machida M, Fujimaki S, Hidaka R, Asashima M, Kuwabara T. Machida M, et al. Stem Cells Int. 2012;2012:959737. doi: 10.1155/2012/959737. Epub 2012 Sep 4. Stem Cells Int. 2012. PMID: 22988465 Free PMC article. - Bone's responses to mechanical loading are impaired in type 1 diabetes.
Parajuli A, Liu C, Li W, Gu X, Lai X, Pei S, Price C, You L, Lu XL, Wang L. Parajuli A, et al. Bone. 2015 Dec;81:152-160. doi: 10.1016/j.bone.2015.07.012. Epub 2015 Jul 13. Bone. 2015. PMID: 26183251 Free PMC article. - Dissecting Long-Term Glucose Metabolism Identifies New Susceptibility Period for Metabolic Dysfunction in Aged Mice.
Chauhan A, Weiss H, Koch F, Ibrahim SM, Vera J, Wolkenhauer O, Tiedge M. Chauhan A, et al. PLoS One. 2015 Nov 5;10(11):e0140858. doi: 10.1371/journal.pone.0140858. eCollection 2015. PLoS One. 2015. PMID: 26540285 Free PMC article.
References
- Friedman JM, Halaas JL. Leptin and the regulation of body weight in mammals. Nature 1998;395:763–770 - PubMed
- Ogawa Y, Masuzaki H, Hosoda K, et al. Increased glucose metabolism and insulin sensitivity in transgenic skinny mice overexpressing leptin. Diabetes 1999;48:1822–1829 - PubMed
- Frederich RC, Hamann A, Anderson S, Löllmann B, Lowell BB, Flier JS. Leptin levels reflect body lipid content in mice: evidence for diet-induced resistance to leptin action. Nat Med 1995;1:1311–1314 - PubMed
- Considine RV, Sinha MK, Heiman ML, et al. Serum immunoreactive-leptin concentrations in normal-weight and obese humans. N Engl J Med 1996;334:292–295 - PubMed
- Ebihara K, Ogawa Y, Masuzaki H, et al. Transgenic overexpression of leptin rescues insulin resistance and diabetes in a mouse model of lipoatrophic diabetes. Diabetes 2001;50:1440–1448 - PubMed
Publication types
MeSH terms
Substances
LinkOut - more resources
Full Text Sources
Medical
Molecular Biology Databases


